
5. DIAGNOSTIC EVALUATION
5.1. Individual early detection and screening
The diagnostic pathway for PCa aims to achieve detection of significant PCa, while leaving insignificant PCa undetected, balancing diagnostic accuracy with the burden on an individual and healthcare resources. Patient-specific factors such as lower urinary tract symptoms (LUTS), family history, age and comorbidity should always be considered.
Men may enter the diagnostic pathway through various indications, including clinical symptoms, opportunistic early detection (individual) or screening (population-based). The prevalence of PCa and significant PCa varies depending on the indication, resulting in different yields of the subsequent diagnostic pathway.
5.1.1. Prostate-specific antigen (PSA)
Regardless of which pathway a patient goes through to his PCa diagnosis, a PSA test will be part of it. For more information on PSA, its production, function and sources of error in PSA assessment, see Section 5.2.2.
5.1.2. Clinical symptoms
Symptoms usually occur late in the natural history of PCa, and localised PCa is therefore usually asymptomatic. Local progression may cause symptoms such as LUTS, erectile dysfunction (ED), retention, local pain, haematospermia, or haematuria. Bone metastases may cause pain or spinal cord compression. Digital rectal examination (DRE) and PSA are usually part of the initial diagnostic workup in these cases, after which a further diagnostic algorithm may be initiated. Definitive diagnosis normally depends on histopathological verification in prostate biopsy cores. However, men with high suspicion of malignancy (e.g. malignant feeling prostate, PSA > 100ng/mL and a positive bone scan) might avoid a biopsy, especially if pre-existing comorbidities would exclude any treatment intensification in the hormone-sensitive or castration-resistant phase in addition to ADT or any future second-line treatments.
5.1.3. Individual early detection
Early detection may be initiated on an individual level, with or without concurring LUTS. As increasing age is a major risk factor for PCa there is very little point in starting diagnostic evaluation too early. In men with no other risk factors, the risk of having a clinically significant PCa (csPCa) under the age of 50 years is low. Therefore, early testing with PSA can be recommended starting at the age of 50. For men with a family history of PCa and for men of African descent, the corresponding age for testing is 45 years (see Section 3.2.1.a), and for men carrying BRCA2 mutations, the corresponding age is 40 years [150,151].
Individuals considering early detection should be aware of the lead time associated plus the risk of detecting clinically insignificant cancers, leading to possible overtreatment, as well as the possibility of improved disease-specific mortality. It is difficult to accurately estimate the individual benefit or harm due to early detection for the individual man, but the effect may be larger than in screening trials because diluting effects from intention-to-treat analyses in population-based intention-to-screen analyses are not applicable (i.e. non-participation: no participation after screening invitation; contamination: screening occurring in control arm) [152]. Nevertheless, a comparison of systematic and opportunistic screening suggested overdiagnosis and mortality reduction in the systematic screening group compared to a higher overdiagnosis with only a marginal survival benefit, at best, in the opportunistic screening regimen [153].
A baseline PSA may be used to predict PCa mortality after 12-20 years and can therefore be used to guide the frequency of follow-up. The risk of dying from PCa by age 85 is ≤ 0.2% for 60-year-old men with PSA concentration below the median of ≤ 1.0ng/mL [154]. Follow-up intervals of 8-10 years may be offered to a majority of men up to the age of 60, and 50% of the men may be reassured and exempted from further screening after the age of 60 years. Follow-up intervals of two years may be offered to those initially at risk (PSA > 1 ng/mL at 40 years; PSA > 2 ng/mL at 60 years) [155-157].
The age at which attempts at an early diagnosis should be stopped remains controversial, but an individual’s life expectancy is the main driver and must be considered. Asymptomatic men who have less than a 15-year life expectancy are unlikely to benefit from an early diagnosis of prostate cancer, based on data from the Prostate Cancer Intervention Versus Observation Trial (PIVOT) and the European Randomised Screening for Prostate Cancer (ERSPC) trials [158]. However, a substantial proportion of these men have prostate cancer that will not cause serious symptoms during their lifetime, meaning the risk of overdiagnosis is high. An even larger proportion have elevated PSA levels due to benign prostatic hyperplasia (BPH), leading to investigations and follow-ups. Therefore, men with a life span of less than 10-15 years should not be PSA tested in the absence of symptoms or clinical signs of PCa. Nevertheless, there is no simple tool to evaluate individual life expectancy and comorbidity is at least as important as age. A detailed review can be found in Section 6.1 and the SIOG Guidelines [159]. Informed men with one of the risk factors above (including age), a life expectancy of > 15 years and requesting investigation should be given a PSA test and undergo a DRE, after which a further diagnostic algorithm may be initiated [160].
Figure 5.1: Flow diagram to assist with decisions on prostate biopsy
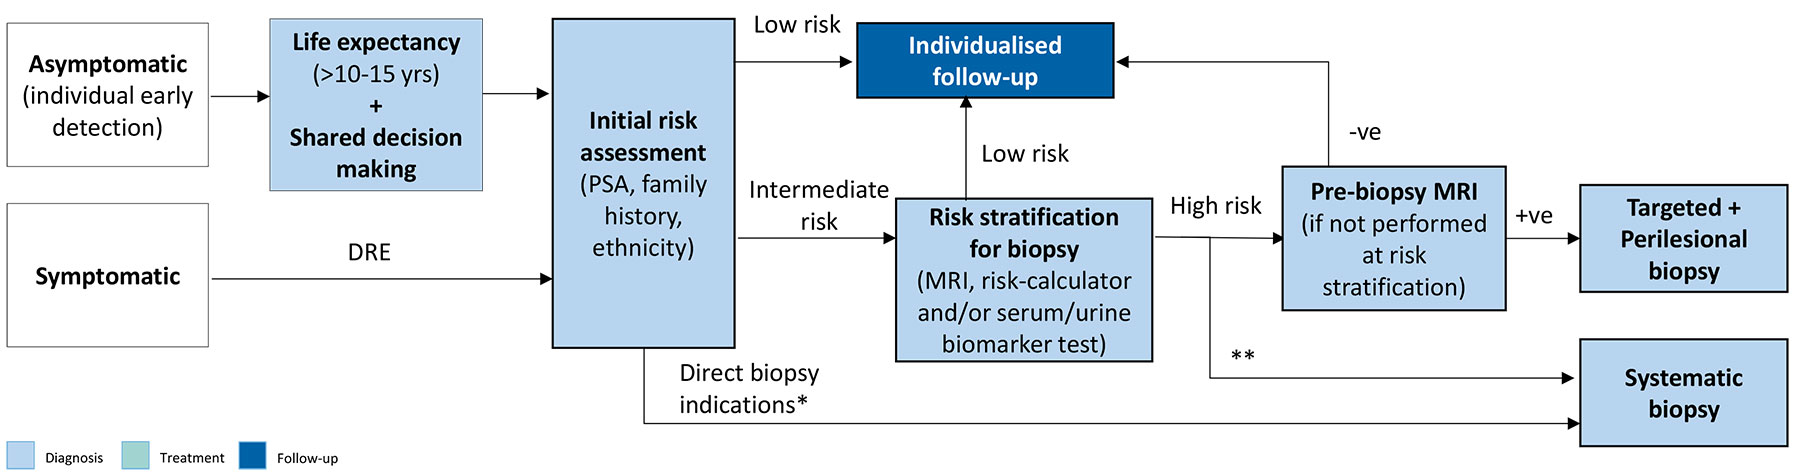
* PSA > 50, cT3-4;
** If MRI not available/possible
5.1.4. Population-based screening
Population screening is defined as the ‘systematic examination of asymptomatic men to identify individuals at risk for a specific disease’ and is usually initiated by health authorities. The co-primary objectives are:
- reduction in mortality due to PCa
- maintained quality of life (QoL) as expressed by QoL-adjusted gain in life years (QALYs)
Metastases free survival rates have also been considered as a relevant endpoint due to impact on QoL.
A Cochrane review of randomised PCa screening trials with PCa mortality as endpoint was published in 2013 [161] and updated in 2018 [162,163]. The main findings of the updated publication from the results of five RCTs, randomising more than 721,718 men, are:
- Screening is associated with an increased diagnosis of PCa (Incidence ratio [IR]: 1.23, 95% CI: 1.03-1.48).
- Screening is associated with detection of more localised disease (RR: 1.39, [1.09-1.79]) and less advanced PCa (T3-4, N1, M1; RR: 0.85 [0.72-0.99]).
- No PCa-specific survival benefit was observed (IR: 0.96 [0.85-1.08]). This was the main endpoint in all trials.
- No overall survival (OS) benefit was observed (IR: 0.99, 95% CI: 0.98-1.01). None of the trials were designed/powered for this endpoint.
The included studies differ in multiple aspects, including trial size, time periods, age groups, participation/compliance rates, previous screening rates (opportunistic testing in control arm, ‘contamination’), one-time screening (i.e., prevalence screening, where patients are invited for PSA test at one time only) vs. repeat screening (where patients are repeatedly invited for PSA-testing over time), and the applied diagnostic pathway. These heterogeneities account for discrepancies in results between single studies and aggregated findings of the Cochrane review and makes the results of the latter difficult to interpret.
Two studies showed a favourable impact of screening: ERSPC and CAP. The CAP study after 15-year follow-up, showed a small but significant reduction in PCSM, despite being only a one-time PSA screening [164].
The ERSPC study started in the early 90s, including > 182,000 European men, found a significant reduction in PCa mortality due to screening. ERSPC applied a mainly PSA-based screening protocol (cut-off 3.0-4.0ng/mL followed by systematic sextant prostate biopsy, every two to four years in men aged 50-74) [158]. The contamination rate was relatively low when compared to other large studies, such as the Prostate Lung Colorectal and Ovarian (PLCO) screening trial [165]. A limitation is the heterogeneity in patient groups and the applied screening protocols. Since 2013, data have been updated with twenty-three years of follow-up [158,166]. With extended follow-up, the mortality reduction (21% and 29% after non-compliance adjustment) remains unchanged. However, the number needed to screen (NNS), the number needed to diagnose (NND) and the number needed to treat (NNT) is decreasing and is now below the NNS observed in breast cancer trials [158,167] (Table 5.1).
Table 5.1: Follow-up data from the ERSPC study [158, 166]
| Years of follow-up | Number needed to screen | Number needed to treat |
| 9 | 1,410 | 48 |
| 11 | 979 | 35 |
| 13 | 781 | 27 |
| 16 | 570 | 18 |
| 23 | 456 | 12 |
In the Rotterdam section of the ERSPC with 21 years of follow-up, the risk ratio of death due to PCa was 0.73 in the screening group, with NNS of 246 and NND of 14 to prevent one death due to PCa [168]. To prevent one metastasized case NNS was 121 and NND seven.
In the Goteborg screening trial, with 18 years of follow-up, the ratio of death from PCa for the screening group compared with the control group was 0.65 (95% CI: 0.49-0.87), and for men commencing screening at age 55-59 it was 0.47 (95% CI: 0.29-0.78) [169]. The NNS was 231 and 10 for the NND. After 22 years of follow-up, the corresponding NNS was 221 and NND was nine, and the highest risk of PCSM was identified in men who started screening at the age of 60 years and in non-attenders [170].
The benefit of screening in reducing PCa-specific mortality (PCSM), and the even more favourable impact on metastases rates is counterbalanced by the side effects of screening, such as increased diagnosis rates, which has led to overtreatment of low-risk PCa, and subsequent treatment-related side effects [171]. Regarding QoL, the beneficial effects of screening and the side effects appear to balance out, resulting in limited overall impact on the invited population [171,172].
All of the screening studies presented above were conducted in the pre-MRI era, with a PSA-based threshold for biopsy, and only systematic biopsies. Recognition of the harms of overdiagnosis and overtreatment had led to a redesign in the pathway for early detection of PCa including identification of specific risk groups, individualised retesting interval, improved indication for biopsy using risk calculators and/or MRI, targeted biopsies, and the application of AS for low-risk disease.
An SR concluded that integrating MRI in PCa screening pathways is associated with a reduction in the number of unnecessary biopsies and overdiagnosis of insignificant PCa, while maintaining csPCa detection as compared with PSA-only screening [173]. There are a number of ongoing screening studies, where MRI +/- other approaches are incorporated. The Gothenburg-2 screening study, including MRI and targeted biopsies only for men with PSA ≥ 3 ng/mL (or ≥ 1.8 ng/mL), has shown that the MRI + targeted biopsies only approach omitted more than half of csPCa, with a very low risk of missing an incurable PCa [174]. In the Stockholm3-MRI study, in which the Stockholm 3 serum test was used before MRI for repeat screening, showed comparable results with lower detection rates of csPCa, but with a reduction of number of MRIs depending on the cut-off value of the Stockholm 3 serum test (≥ 0.11 or ≥ 0.15) [175]. Other ongoing screening trials are the Finish ProScreen trial, where a 4-kallikrein panel risk score was used before MRI, and the German PROBASE study on screening of younger men (from the age of 45); however, the data from these studies remain preliminary at this point in time [176,177]. An SR also concluded that risk-based screening followed by MRI testing seemed to be more cost-effective than no screening [178].
After a negative screening, PSA measurement must be repeated as long as life expectancy remains favourable [179], but the optimal intervals for PSA follow-up are unknown, as they varied between several prospective screening trials. A risk-adapted strategy might be a consideration, based on the initial PSA level. Men with a baseline PSA < 1ng/mL at 40 years or < 2ng/mL at 60 years are at decreased risk of PCa metastasis or death from PCa several decades later [48,156]. The retesting interval can therefore be every two years for those initially at increased risk or postponed up to eight years for those at low risk [156,180].
An analysis of ERSPC data supports a recommendation for an eight-year screening interval in men with an initial PSA concentration < 1ng/mL. Fewer than 1% of men with an initial PSA concentration < 1ng/mL were found to have a concentration above the biopsy threshold of 3ng/mL at four-year follow-up. The cancer detection rate by eight years was close to 1% [181]. The long-term survival and QoL benefits of extended PSA retesting (every eight years) remain to be proven at a population level.
5.1.5. Screening in patients with BRCA mutations
The IMPACT study evaluates targeted PCa screening using PSA in men aged 40-69 years with germline BRCA1/2 mutations (annually, biopsy recommended if PSA > 3.0ng/mL). After three years of screening, BRCA2 mutation carriers were associated with a higher incidence of PCa, a younger age of diagnosis, and more clinically significant tumours compared with noncarriers [151,182]. The influence of BRCA1 mutations on PCa remained unclear. No differences in age or tumour characteristics were detected between BRCA1 carriers and BRCA1 noncarriers. The mismatch repair cohort of IMPACT in men with MSH2 and MSH6 pathogenic variants found a higher incidence of significant PCa versus noncarriers [183]. The uncertainties in the benefits to harm ratio for screening also applies in the group.
5.1.6. Genetic testing for inherited prostate cancer
Increasing evidence supports the implementation of genetic counselling and germline testing in early detection and PCa management [184]. Several commercial screening panels are now available to assess the main PCa risk genes [185]. However, it remains unclear when germline testing should be considered and how this may impact localised and metastatic disease management. Germline BRCA1 and BRCA2 mutations occur in approximately 0.2% to 0.3% of the general population [27,186]. It is important to understand the difference between somatic testing, which is performed on the tumour, and germline testing, which is performed on blood or saliva and identifies inherited mutations. Genetic counselling is required prior to and after undergoing germline testing. Somatic testing should be considered for all patients presenting with metastatic PCa and fit enough to consider a PARPI.
Germline mutations can drive the development of aggressive PCa. Therefore, the following men, with a family history of high-risk germline (DNA repair gene) mutations or a family history of multiple cancers on the same side of the family should be considered for germline testing:
- Men with BRCA mutations on somatic testing.
- Men with metastatic PCa who are candidates for targeted treatment.
- Men with multiple family members diagnosed with csPCa at age < 60 years or a family member who died from PCa.
5.2. Diagnostic tools
Various diagnostic tools are available for the diagnosis of prostate cancer (PCa). These tools can be used separately, or in multi-tier combinations and/or sequences. Usually, diagnosis is confirmed histopathologically using prostate biopsy.
5.2.1. Digital rectal examination
In approximately 18% of cases, PCa is detected by suspect DRE alone, irrespective of PSA level [187]. A suspect DRE in patients with a PSA level ≤ 4ng/mL has a positive predictive value (PPV) of 5-30% [187]. In the ERSPC trial screening setting, an abnormal DRE in conjunction with an elevated PSA more than doubled the risk of a positive biopsy (48.6% vs. 22.4%) [188]. Abnormal DRE is an indication for MRI, or direct biopsy in case of suspicion of extracapsular disease (cT3-4) [188,189]. An abnormal DRE is associated with an increased risk of a higher ISUP GG (GG), predicts clinically significant PCa in men under active surveillance (AS) [190] and remains a strong predictor of advanced PCa (OR: 11.12 for cT3 and OR: 5.28 for cT4) [191]. Clinical T staging, as well as current EAU risk group stratification, depends on DRE.
5.2.2. Prostate-specific antigen
Prostate-specific antigen is a glycoprotein enzyme secreted by prostate epithelial cells with a small portion present in the blood stream. It is the primary test when there is a suspicion of PCa. Its use as a serum marker has revolutionised PCa diagnosis [192]. Prostate-specific antigen is organ-specific but not cancer-specific; therefore, it may also be elevated in BPH, prostatitis and other non-malignant conditions. There are no agreed standards for defining abnormal PSA thresholds [193]. It is a continuous parameter, with higher levels indicating greater likelihood of PCa. Rarely some men may harbour PCa despite having low serum PSA [194].
In a screening situation, the most frequently applied threshold for PSA is ≥ 3.0ng/mL, resulting in 16.5% of invited men returning a positive test [195]. Due to differences in cancer prevalence, protocol for referral, and diagnostic algorithm, the risk of finding PCa at a specific PSA threshold in a clinical cohort may be different than in a screening situation. Prostate-specific antigen retains its diagnostic value for cancer detection in symptomatic/referred patients. A review and meta-analysis on the diagnostic accuracy of PSA (≥ 4.0ng/mL) for the detection of PCa in clinically referred men found an estimated combined sensitivity of 0.93 and specificity of 0.20 [196].
Prostate-specific antigen production is androgen--dependent and 5α-reductase inhibitors (e.g. finasteride, dutasteride), used for benign prostatic enlargement of the prostate, reduce PSA levels by 50% [197]. In such cases, PSA level should be corrected to decide on further investigation, although PSA density is less impacted because prostate volume decreases concomitantly.
In case of a moderately elevated PSA, a repeat test after a few weeks should be considered to confirm the indication for further diagnostic analysis, because one-third of men with a PSA < 10ng/mL had a difference of greater than +/- 1.0ng/mL at the second measurement [198]. Within 1-2 months, PSA drops to below 3ng/mL in approximately one-fifth of men.
A repeat PSA test before prostate biopsies in men with an initial PSA 3-10ng/mL reduced the indication for biopsies in 16.8% of men while missing 5.4% ISUP GG > 1 in the Stockholm3 trial [199]. Similarly, in the Prostate Testing for Cancer and Treatment (ProtecT) trial, men with a more than 20% lower repeat-PSA analysis within seven weeks had a lower risk of PCa (OR: 0.43, 95% CI: 0.35-0.52), as well as a lower risk of ISUP GG ≥ 2 (OR: 0.29, 95% CI: 0.19-0.44) [200]. Based on the above, a PSA of 3-10ng/mL in men without suspicious findings on palpation should prompt a second PSA test after four weeks. If the PSA has normalised, a new PSA test can be performed after one year.
Repeat PSA should be performed in the same laboratory using the same assay under standardised conditions (i.e. no ejaculation, manipulations and urinary tract infections [UTIs]) [201,202]. The type of PSA assay used may impact PSA values and rates of PSA above certain fixed thresholds [203]. Table 5.2 presents sources of error in PSA value assessment.
Table 5.3: Sources of error in PSA value assessment
| Sources of error in PSA value assessment |
|
5.2.3. Prostate-specific antigen density
Prostate-specific antigen density (PSA-D) is the level of serum PSA divided by the prostate volume. The higher the PSA-D, the more likely clinically significant PCa is present; particularly in smaller prostates when a PSA-D cut-off of 0.15ng/mL/cc was applied [195]. Several studies found a PSA-D over 0.1-0.15ng/mL/cc predictive of PCa [212,213]. Patients with a PSA-D below 0.09ng/mL/cc were found unlikely (4%) to be diagnosed with csPCa [214]. PSA-D is also one of the strongest predictors incorporated in risk calculators for biopsy decisions [215].
PSA-D based on volume estimation assessed by DRE is imperfect due to an underestimation of prostate volume [216]. A lack of standardisation of prostate volume estimation exists in imaging-based prostate volume estimation as TRUS or MRI use various techniques such as ellipsoid formula or planimetry. Nonetheless, one study involving seven radiologists who assessed prostate volume on 40 MRI scans using two different ellipsoid methods and a manual planimetry method suggested that intra- and inter-reader reproducibility of the three methods were excellent with intraclass correlation coefficient > 0.90 [217]. In a series of 640 men, TRUS found prostate volumes on average 8% smaller than MRI. In the 109 men who underwent RP, MRI-derived prostate volume was better correlated to the volume of the surgical specimen than TRUS-derived volume [218].
Transabdominal ultrasound evaluation of prostate volume leads to an overestimation of the prostate volume by 9.9mL [219].
PSA-D remains predictive for csPCa when combined with MRI PIRADS scores [220,221].
5.2.4. Magnetic resonance imaging
5.2.4.a. Diagnostic performance
Prostate MRI combines several imaging sequences to identify PCa accurately. MRI is initiated upon suspicion of PCa based on PSA and/or DRE. In addition to suggesting the presence of PCa, imaging also enables guidance in targeted prostate biopsy and provides staging information.
Prostate cancer appears as areas with low signal intensity on T2-weighted imaging, restriction of diffusion on diffusion-weighted imaging, and early and intense enhancement on dynamic contract enhanced imaging. However, there is substantial overlap between the appearances of PCa and some prostate benign conditions.
Correlation with RP specimens shows good sensitivity for MRI in the detection and localising of ISUP GG ≥ 2 cancers, especially when their diameter is larger than 10mm. MRI is less sensitive in identifying ISUP GG 1 PCa [222-225]. The good sensitivity of MRI for ISUP GG ≥ 2 cancer was further confirmed in patients who underwent template biopsies. In a Cochrane meta-analysis comparing MRI to template biopsies (≥ 20 cores) in biopsy-naive and repeat-biopsy settings, MRI had a pooled sensitivity of 0.91 (95% CI: 0.83-0.95) and a pooled specificity of 0.37 (95% CI: 0.29-0.46) for ISUP GG ≥ 2 cancers. For ISUP GG ≥ 3 cancers, MRI-pooled sensitivity and specificity were 0.95 (95% CI: 0.87-0.99) and 0.35 (95% CI: 0.26-0.46), respectively [226].
The Prostate Imaging-Reporting and Data System (PI-RADS) standardises interpretation and stratifies patients with suspected PCa on a 1- to 5- risk scale of having csPCa, where patients with a PI-RADS 3-5 lesion are considered at risk of csPCa and, therefore, may be candidates for MRI-targeted prostate biopsy. The PI-RADS document has been revised twice, and version 2.1 is currently used [227,228].
A meta-analysis of PI-RADS v2.1 that used transrectal or transperineal biopsy data findings as reference, found that ISUP GG ≥ 2 cancer detection rates at patient level were 6% [95% CI: 3-12%] for PI-RADS 1, 6% [3-11%] for PI-RADS 2, 20% [15-26%] for PI-RADS 3, 55% [45-65%] for PI-RADS 4, and 83% [78-88%] for PI-RADS 5 [229]. The median prevalence for csPCa was 43%. Of note, the cancer detection rates are positive predictive values and, as such, depend on prevalence.
In another meta-analysis, the median cancer detections rate was also 6% for PI-RADS 1-2 categories, but varied from 3% when the PSA density (PSA-D) was below 0.10 ng/mL to 18% when the PSA-D was above 0.20 ng/mL. PSA-D also allowed risk stratification of PI-RADS 3 and 4-5 categories (see Table 5.5) [230].
Most MRI histological correlations [231], but not all [232], suggest that visibility at MRI is associated with molecular hallmarks of aggressiveness, and thus, that MRI-invisible cancers could harbour a better prognosis. Similarly, although preliminary studies suggested that cancers with intraductal/cribriform patterns were MRI-invisible, larger series showed that these aggressive patterns were MRI-visible in more than 95% of the cases and tended to be associated with high PI-RADS scores [233,234].
5.2.4.b. Image quality and inter-reader reproducibility
Quality assurance and quality control programs are crucial for improving image quality and reducing diagnostic errors. Image quality has substantial impact on MRI performance [235] and most discrepancies between MRI and biopsy results may be explained by suboptimal image quality and basic mistakes in interpretation [236]. Guidelines standardise patient preparation and imaging protocols [228,235,237]. The prostate image quality (PI-QUAL) score provides simple criteria to assess image quality and decides when to repeat the examination [238] and is a convenient tool to follow improvements in quality [239].
Despite the use of the PI-RADS scoring system, MRI inter-reader reproducibility remains moderate at best. MRI performance is better with experienced radiologists and at high-volume centres, which currently limits its broad use by non-dedicated radiologists [237,240]. Certification programs are being developed in Europe to improve image and interpretation quality through continuous education, outcome audits and feedback via peer review [241]. Interdisciplinary cooperation with pathological correlation and feedback is also crucial to improving MRI interpretation [242,243].
5.2.4.c. Circumstances for biparametric MRI
The steadily increasing demand for diagnostic prostate MRI has led to concerns regarding the lack of access to and the availability of qualified MRI scanners and sufficiently experienced radiologists, radiographers, and technologists to meet the demand. Solutions must enhance operational benefits without compromising diagnostic performance, quality, and delivery of service. Solutions should also mitigate risks such as decreased reader confidence and referrer engagement. One approach may be the implementation of MRI without the use gadolinium-based contrast medium (biparametric MRI), but only if certain prerequisites such as high-quality imaging, expert interpretation quality, and availability of patient recall are mandated [241]. Alternatively, or in combination, a clinical risk-based approach could be used for protocol selection, specifically, which biopsy-naive men need MRI with contrast medium (multiparametric MRI). Similar diagnostic accuracies have been shown between both approaches in several meta-analyses [244-246]; however, conclusions were based on retrospective analyses of single-centre data and small sample sizes, in which decisions were made on multiparametric MRI, rather than biparametric (non-contrast) MRI.
The PRIME study, was a prospective, multicentre, within-patient, noninferiority trial of 490 biopsy-naive patients with clinical suspicion of PCa (elevated PSA level and/or abnormal DRE findings) from 22 centres [247]. A positive MRI was defined as Likert suspicions scores 3 to 5. Results were consistent when using the PI-RADs v2.1 instead of the Likert scoring system. Biparametric MRI was noninferior to multiparametric MRI, detecting GG ≥ 2 cancers in 29.2%, compared with 29.6% (difference, −0.4% [95% CI: −1.2 to 0.4], p = 0.50). Biparametric and multiparametric MRI showed a sensitivity of 98.0% (95% CI: 94.2-99.6) and 99.3% (95% CI: 96.3-100.0) and a specificity of 61.6% (95% CI: 56.1-66.8) and 60.1% (95% CI: 54.6-65.4), respectively. Biparametric MRI detected ISUP GG 1 cancers in 9.2%, compared with 9.6% with the use of multiparametric MRI (difference, −0.4% [95% CI: −1.2 to 0.4]). Central quality control demonstrated that 99% of scans were of adequate diagnostic quality.
The PI-CAI Consortium conducted a retrospective non-inferiority observer study of 400 biopsy-naive patients with clinical suspicion of PCa (elevated PSA level and/or abnormal DRE findings) from four European centres [248]. A positive MRI was defined as PI-RADS scores 3-5. Biparametric MRI was noninferior to multiparametric MRI, detecting ISUP GG ≥ 2 cancers in 29.3%, compared with 29.5%. Biparametric MRI detected ISUP GG 1 cancers in 9.8%, compared with 10.0% with the use of multiparametric MRI. Biparametric MRI was noninferior to multiparametric MRI in AUROC (difference of -0.6% [95% CI; -1.2 to 0.1], p < 0.001), sensitivity (difference of - 0.9% [95% CI: -1.7 to 0.0], p < 0.001) and specificity (difference of 0.9% [95% CI: 0.0-1.8], p < 0.001). The study’s cohort exhibited a wide range of image quality, where the majority (65%) achieved an overall PI-QUAL score of 2-3 in multiparametric MRI scans.
The PI-RADS recommendations (2021) on the use of biparametric MRI in some circumstances are still valid, but only if certain prerequisites such as high-quality imaging, expert interpretation quality, and availability of patient recall are mandated [241].
5.2.4.d. Quantitative approaches and artificial intelligence
As the PI-RADS criteria remain subjective, approaches using quantitative thresholds for imaging biomarkers (e.g. the apparent diffusion coefficient or enhancement parameters) have been proposed [249]. However, there is still a large variability in these biomarker values across suppliers, MRI scanners and imaging protocols, which currently makes them difficult to be widely used [250-252].
The integration of artificial intelligence (AI)-based algorithms into prostate MRI workflows may address the limitations associated with single-reader interpretations, such as intra- and inter-reader variability and diagnostic errors, and may also improve reading times [253]. AI-based algorithms as standalone have recently provided excellent results in detecting ISUP GG ≥ 2 PCa on MRI and can even outperform experienced human readers [254-258]. However, AI algorithms tend to show decreased performance when tested on images from a different vendor or acquired with different image parameters as compared to their training dataset [259]. It is therefore essential to test them on external cohorts to assess their generalisability [260]. To date, only a few AI systems have been assessed on truly external multicentric cohorts [261]. Two prospective studies have tested AI algorithms on external cohorts. In one, the AI system had lower sensitivity 87.6% (95% CI: 79.4-93.4) versus 99% (95% CI: 94.4-100); p=0.005) but higher specificity 64.8% (95% CI: 55-73.8) verses 31.3% (95% CI: 14-30.2;
p < 0.001) than human reading [257]. In the other, the algorithm detected csPCa missed by human reading in 4% of patients, but at the expense of a doubling of the false positive rate (0.66 vs. 1.39) [262].
Additionally, the complex dynamics of human-AI interaction and the potential AI-integrated workflow strategies (e.g. using AI as a triage tool, a decision support or an independent second reader) warrant further investigation [253].
5.2.5. Ultrasound-based techniques
5.2.5.a. Transrectal ultrasound (TRUS)
Standard TRUS is not reliable for detecting PCa [263] and the diagnostic yield of additional biopsies performed on hypoechoic lesions is negligible [264]. Artificial intelligence algorithms trained to detect PCa on TRUS images have shown promising preliminary results, but confirmation of these results in independent cohorts is required.
5.2.5.b. Micro-ultrasound
High-resolution micro-ultrasonography (micro-US) operates at 29 MHz with a spatial resolution of 70 microns. This allows, in theory, the visualisation of normal prostate ducts and of PCa foci that alter the ductal architecture. The Prostate Risk Identification using Micro-UltraSound (PRI-MUS) score assessed the risk of malignancy for focal lesions, with scores of 1-2 considered low-risk, 3 equivocal, and 4-5 suspicious [265].
Two prospective trials assessed MRI and micro-US interpreted in a blinded manner before combined targeted and systematic biopsy. In one, MRI and micro-US detected 60 (76%) and 58 (73%) of the 79 csPCa, respectively, while systematic sampling detected 45/79 cases (57%). MRI-targeted biopsy detected seven csPCa missed by micro-US, three of which were anterior lesions. Micro-US-guided biopsy detected five csPCa missed by MRI, three of which were at the apex [266]. In the other study, MRI- and micro-US-targeted biopsy depicted csPCa in 37 (39%) and 33 (35%) of the 94 men, respectively, while the MRI- plus micro-US-targeted pathway detected 38 csPCa [267]. These findings suggest that MRI and micro-US could complement each other. Micro-US could also be an interesting alternative to MRI/US fusion allowing direct targeting of MRI lesions and potential detection of additional suspicious lesions. However, this technique has limitations which should be acknowledged. Because of the use of high-frequency ultrasound with low(er) wave penetration, the transrectal visualisation of the anterior part of large prostates remains suboptimal. In a series of 92 PI-RADS ≥ 3 lesions in the transition zone, 21 (23%) were invisible on micro-US, even when the operator was aware of the MRI results [268]. In a prospective trial involving six experienced readers, sensitivity for ISUP GG ≥ 2 PCa increased from 0.66±0.05 to 0.87±0.09 when cases with anterior tumours were excluded [269]. Micro-US may also generate a substantial proportion of false positive findings. In one prospective trial, the percentages of csPCa were similar in men with positive micro-US and in those with positive MRI findings (41% vs. 39%) [266]. However, in another study, micro-US detected 33 csPCa by sampling 162 suspicious lesions (10% of patients with micro-US negative findings [PRIMUS 1-2]), while MRI detected 38 csPCa while sampling 93 lesions (34% of patients with MRI-negative findings (PI-RADS 1-2) [267]. In a recent RCT, the percentage of patients with negative findings was 20% (71/347) for micro-US versus 32% (179/557) for MRI [270]. Finally, micro-US interoperator variability has rarely been evaluated. In a prospective series of 57 patients, the light’s kappa value for localising the lesions across six experienced readers was only 0.30 (95% CI: 0.21-0.39) [269].
Since most available data were obtained at high-volume well-trained centres, a learning curve and a volume effect on quality outcomes similar to what was observed after the introduction of MRI is expected.
5.2.5.c. Other ultrasound-based methods
Colour-Doppler, sonoelastography or contrast-enhanced US provided promising preliminary findings, either alone, or combined into the so-called ‘multi-parametric US’ [271,272]. In the multi-parametric US versus multi-parametric MRI to diagnose PCa (CADMUS) trial, 306 patients underwent both multi-parametric MRI and multi-parametric US composed of B-mode, Colour Doppler, real-time elastography, and contrast-enhanced US. Patients with at least one positive test underwent targeted biopsy. Multi-parametric US detected 4.3% fewer csPCa while submitting 11.1% more patients to biopsy than MRI [273].
5.2.6. Prostate-specific membrane antigen-positron emission tomography/computed tomography
Though mainly used for staging purposes, hybrid radiolabelled PSMA-PET imaging (i.e., PET/CT or PET/MRI) may be used to indicate the precise location for targeted biopsies, as well as to follow candidates in active surveillance setting. For csPCa detection, a pooled sensitivity of 0.89 and a pooled specificity of 0.56 have been reported [274].
In a prospective trial of 291 patients, combined PSMA PET + MRI improved negative predictive value (NPV) compared with MRI alone (91% vs. 72%, test ratio = 1.27 [1.11-1.39], p < 0.001). Sensitivity also improved (97% vs. 83%, p < 0.001), but specificity was reduced (40% vs. 53%, p = 0.011) [136]. The PRIMARY score was shown to be valid only when using harmonised PET cameras and the same PSMA PET ligands [136]. A post hoc analysis of the PRIMARY study evaluated the clinical significance of patterns of intraprostatic PSMA activity, proposing a five-point score to optimise the accuracy of radiolabelled-PSMA PET/CT for csPCa. Key patterns used within the PRIMARY score demonstrated an improved specificity and diagnostic accuracy for the detection of csPCa. Sensitivity, specificity, PPV, and NPV for a PRIMARY score of 1 or 2 (low-risk patterns) versus a PRIMARY score of 3-5 (high-risk patterns) were 88%, 64%, 76%, and 81%, respectively, compared with 83%, 53%, 69%, and 72%, respectively, for a PI-RADS score of 2 versus 3-5 on mpMRI [275].
A composite P score combining MRI and PRIMARY score was proposed for more accurate diagnosis of csPCa [276]. The Standardised Prostate-specific Membrane Antigen Positron Emission Tomography/Computed Tomography Analysis and Reporting Consensus (SPARC) project offers the adoption of harmonised and reproducible frameworks for reporting of PSMA PET/CT, including molecular imaging (mi) for PSMA expression, miTNM PROMISE classification for reporting of PSMA PET/CT, the PRIMARY score for intraprostatic staging, PSMA volume, mean standardised uptake value (SUVmean), and maximum standardised uptake value (SUVmax) [277].
A systematic review and meta-analysis focusing on the role of PSMA PET for PCa diagnosis and primary staging before definitive treatment revealed good accuracy for intraprostatic diagnosis and staging, with a sensitivity, specificity, PPV, and NPV of PSMA PET for csPCa of 82% (95% CI: 73-90%), 67% (95% CI: 46-85%), 77% (95% CI: 63-88%), and 73% (95% CI: 56-87%), respectively [278].
5.2.7. Blood and urine biomarkers
Urine and serum biomarkers, as well as tissue-based biomarkers, have been proposed for improving detection and risk stratification of PCa patients, potentially avoiding unnecessary biopsies and/or unnecessary imaging. However, their efficacy has not been validated [279].
5.2.7.a. Blood based biomarkers: PHI/4K score/IsoPSA/Stockholm3/Proclarix
The use of biomarkers (included in a nomogram) may help in predicting indolent PCa [280,281]. Several assays measuring a panel of kallikreins in serum or plasma are now commercially available, including the United States Food and Drug Administration (FDA)- approved Prostate Health Index (PHI) test (combining free and total PSA and the [-2]pro-PSA isoform [p2PSA]), and the four kallikrein (4K) score test (measuring free, intact and total PSA and kallikrein-like peptidase 2 [hK2] in addition to other parameters, such as age, DRE and prior biopsy status). Both tests are intended to reduce the number of unnecessary prostate biopsies in PSA-tested men. Several prospective multicentre studies demonstrated that both the PHI and 4K score test outperformed f/t PSA for PCa detection, with an improved prediction of csPCa in men with a PSA between 2-10ng/mL [282,283]. In a head-to-head comparison both tests performed equally [284].
In contrast to the 4K score and PHI, which focus on the concentration of PSA isoforms, IsoPSA utilises a technology which focuses on the structure of PSA. In a multicentre prospective validation in 271 men, the assay area under curve (AUC) was 0.784 for high-grade versus low-grade cancer/benign histology, which was superior to the AUCs of total PSA and percent free PSA [208]. In men with a negative mpMRI, PSA-D, 4K score and family history predicted the risk of csPCa on biopsy and using a nomogram reduced the number of negative biopsies and indolent cancers by 47% and 15%, respectively, while missing 10% of csPCa [285].
The Stockholm3 test is a prediction model that is based on several clinical variables (age, first-degree family history of PCa, and previous negative biopsy), blood biomarkers (total PSA, f/t PSA, human kallikrein 2, macrophage inhibitory cytokine-1, and microseminoprotein-β [MSMB]), and a polygenic risk score for predicting the risk of PCa with ISUP GG ≥ 2, and was shown to reduce the percent of clinically insignificant cancers when used in combination with MRI in a PSA screening population [286]. It also has the potential to decrease the number of mpMRI scans required in prostate cancer screening [287].
The Proclarix® test is a blood-based test that estimates the likelihood of csPCa according to measurement results for thrombospondin-1, cathepsin D, total PSA, percentage free PSA and patient age. This test has been correlated with the detection of csPCa, notably in case of equivocal MRI (PI-RADS 3 lesions) [288].
5.2.7.b. Urine biomarkers: PCA3/SelectMDX/MyProstateScore (MPS/MPS2)/ExoDX
Prostate cancer gene 3 (PCA3) is an overexpressed long non-coding RNA (lncRNA) biomarker that is detectable in urine sediments obtained after three strokes of prostatic massage during DRE. However, the clinical utility of the commercially available Progensa urine test for PCA3 for biopsy decision-making remains unclear. Still, combining MRI findings with the PCA3 score may improve risk stratification [289].
The SelectMDX test is similarly based on mRNA biomarker isolation from urine. The presence of HOXC6 and DLX1 mRNA levels is assessed to provide an estimate of the risk of both presence of PCa on biopsy as well as presence of high-risk cancer [290]. A multi-centre trial evaluated SelectMDX in men with an MRI PI-RADS score < 4 or PI-RADS score < 3, and the percentage of missed csPCas was 6.5% and 3.2%, respectively, whereas 45.8% and 40% of biopsies were avoided [291]. Hendriks et al. found more biopsies were avoided and more high-grade PCas detected in an MRI-based biopsy strategy compared to a SelectMDX strategy. When both tests were combined, more Gleason grade > 1 lesions were found, but the number of negative or low-grade cancer biopsies more than doubled [281]. Combining SelectMDX and MRI in men with a PSA between 3-10ng/mL had a negative predictive value (NPV) of 93% [292]. The clinically added value of SelectMDX in the era of upfront MRI and targeted biopsies remains unclear [293].
TMPRSS2-ERG fusion, a fusion of the transmembrane protease serine 2 (TMPRSS2) and the ERG gene can be detected in 50% of PCas [294]. When detection of TMPRSS2-ERG in urine was added to PCA3 expression and serum PSA (MyProstateScore [MPS]), cancer prediction improved [295]. An update of the test, MyProstateScore 2.0 (MPS2), in which an 18-gene score was used, outscored the original MPS model significantly [296]. Exosomes secreted by cancer cells may contain mRNA diagnostic for high-grade PCa [297,298]. Use of the ExoDx Prostate IntelliScore urine exosome assay resulted in avoiding 27% of unnecessary biopsies when compared to standard of care (SOC). However, both the MiPS score and ExoDx assay are currently considered investigational.
In the screening population of the ERSPC study, the use of both PCA3 and 4K panel when added to the risk calculator led to an improvement in AUC of less than 0.03 [299]. Based on the available evidence, some biomarkers could help in discriminating between aggressive and nonaggressive tumours with an additional value compared to the prognostic parameters currently used by clinicians [300]. However, upfront MRI is also likely to affect the utility of the above-mentioned biomarkers.
A review of the different biomarkers, used individually and in combination, concluded that although the results from the various urine-based biomarker tests were promising no one specific test could be recommended for clinical practice at present [301].
5.2.8. Recommendations for individual early detection and germline testing*
| Recommendations | Strength rating |
| Offer an individualised risk-adapted strategy for early detection to well-informed males with a life expectancy of at least 15 years. | Weak |
Offer early prostate-specific antigen (PSA) testing to well-informed men at elevated risk of having PCa:
| Strong |
Offer a risk-adapted strategy (based on initial PSA level) with follow-up intervals of two years for those initially at risk:
Postpone follow-up for up to eight years in those not at risk. | Weak |
| Stop early diagnosis of PCa based on life expectancy and performance status. Males who have a life expectancy of less than 15 years are unlikely to benefit. | Strong |
| In asymptomatic males with a PSA level between 3 and 10 ng/mL initially repeat PSA testing prior to further investigations. | Weak |
In asymptomatic males with a PSA level between 3 and 20 ng/mL use one of the following tools for biopsy indication:
| Strong |
| Weak |
| Germline testing* | |
| Advise germline testing in patients with multiple family members diagnosed with PCa at age < 60 years or a family member who died from PCa < 60 years. | Weak |
| Offer germline testing in patients with a family history of high-risk germline mutations or a family history of multiple cancers on the same side of the family. | Strong |
| Offer germline testing to patients with BRCA mutations on somatic testing. | Strong |
*Genetic counselling is required prior to germline testing.
5.3. Pathology of prostate needle biopsies
5.3.1. Processing
Prostate needle core biopsies from various sites are processed separately, as delivered by the biopsy operator. Before processing, the number and length of the cores are recorded. The length of biopsy tissue significantly correlates with the PCa detection rate [302]. If individual cores can clearly be identified in submitted jars, a maximum of three cores should be embedded per tissue cassette, and sponges or paper should be used to keep the cores stretched and flat to achieve optimal flattening and alignment [303,304]. To optimise detection of small lesions and improve accuracy of grading, paraffin blocks should be cut at three levels and intervening unstained sections may be kept for immunohistochemistry (IHC) [305].
5.3.2. Microscopy and reporting
Diagnosis of PCa is based on histology. The diagnostic criteria include features pathognomonic of cancer, major and minor features favouring cancer and features against cancer. Ancillary staining and additional (deeper) sections should be considered if a suspect lesion is identified [305]. Diagnostic uncertainty is resolved by intradepartmental or external consultation [305]. Sections 5.3.2.a and 5.3.2.b list the recommended terminology and item list for reporting prostate biopsies [304]. Type and subtype of PCa should be reported, such as acinar adenocarcinoma, ductal adenocarcinoma and small or large cell neuroendocrine carcinoma, even if representing a small proportion of the PCa. The distinct aggressive nature of small/large cell neuroendocrine carcinoma should be commented upon in the pathology report [304]. In addition to grading acinar and ductal adenocarcinoma, the percentage of Gleason grade 4 component should be reported in Gleason score 7 (3+4 and 4+3) PCa biopsies. Percentage Gleason grade 4 has additional prognostic value and is considered in some AS protocols [306,307]. Data suggest that the amount of Gleason grade 3 and 4 proportion have no additional impact on adverse pathology, once Gleason grade 4’s absolute volume is known. Biopsy Gleason grade 4 length has predictive value for adverse pathology and BCR-free survival, and may have better discriminative value than Gleason grade 4 percentage [308-310]. However, further studies comparing the performance of Gleason grade 4 length and percentage and establishing clinically useful cut-offs are needed. Considerable evidence has been accumulated in recent years supporting the idea that, among the Gleason grade 4 patterns, cribriform pattern carries an increased risk of biochemical recurrence, metastatic disease and death from disease [311-314]. Reporting of this sub-pattern based on established criteria is recommended [118,315]. Intraductal carcinoma, defined as an extension of cancer cells into pre-existing prostatic ducts and acini, distending them, with preservation of basal cells [118], should be distinguished from high-grade prostatic intraepithelial neoplasia (PIN) [316] as it conveys unfavourable prognosis in terms of biochemical recurrence and cancer-specific survival (CSS) [317,318]. Its presence should be reported whether occurring in isolation or associated with adenocarcinoma [118]. Some intraepithelial lesions have architectural complexity and/or cytological atypia exceeding those of high-grade PIN but fall short for a definitive diagnosis of IDC. These lesions are referred to as Atypical Intraductal Proliferation (AIP) and amongst others encompass lesions that were previously classified as cribriform high-grade PIN. Small retrospective series suggest that AIP at biopsy is associated with unsampled IDC [319,320]. Therefore, presence of AIP should be reported and commented on in non-malignant biopsies and biopsies with ISUP GG 1 and 2 cancers in the absence of overt invasive cribriform and IDC [321].
Prostatic intraepithelial neoplasia (PIN) is considered to be the precursor of PCa, and is microscopically categorised as low- or high-grade PIN. Since low-grade PIN has low reproducibility and lacks predictive value for PCa, it should not be reported. The clinical impact of high-grade PIN is unknown, specifically its predictive value for clinically significant PCa in the MRI era [321]. Atypical small acinar proliferations (ASAP) suspicious for PCa are detected in < 5% of prostate biopsies. A SR and meta-analysis, from the pre-MRI era, showed that repeat biopsies had PCa in 31% with a pooled incidence of 12% csPCa. The incidence of csPCa was lower for repeat biopsies taken within six months than for those taken after more than six months [322].
5.3.2.a. Recommended terminology for reporting prostate biopsies [323]
| Recommended terminology |
| Benign/negative for malignancy - if appropriate, include a description |
| Active inflammation |
| Granulomatous inflammation |
| High-grade prostatic intraepithelial neoplasia (PIN) |
| High-grade PIN with atypical glands, suspicious for adenocarcinoma |
| Focus of atypical glands/lesion suspicious for adenocarcinoma/atypical small acinar proliferation, suspicious for cancer |
| Adenocarcinoma, provide type and subtype, and presence or absence of cribriform pattern |
| Atypical intraductal proliferation (AIP), suspicious for intraductal carcinoma |
| Intraductal carcinoma |
Each biopsy site should be reported individually, including its location (in accordance with the sampling site) and histopathological findings, which include the histological type and the 2019 ISUP GG [118,324,325]. For MRI-targeted biopsies consisting of multiple cores per target, the aggregated (or composite) ISUP GG should be reported per targeted lesion [118]. If the targeted biopsies are negative, presence of specific benign pathology should be mentioned, such as dense inflammation, fibromuscular hyperplasia or granulomatous inflammation [118,326]. Reporting a global ISUP GG comprising all systematic (nontargeted) and targeted biopsies in conjunction to the GG per biopsy site is optional. The global ISUP GG takes into account all biopsies positive for carcinoma by estimating the total extent of each Gleason grade present. For example, if three biopsy sites are entirely composed of Gleason grade 3 and one biopsy site is composed of Gleason grade 4 only, the global ISUP GG would be 2 (i.e. GS 7[3+4]) or 3 (i.e. GS 7[4+3]), depending on whether the extent of Gleason grade 3 exceeds that of Gleason grade 4, whereas the worst grade would be ISUP GG 4 (i.e. GS 8[4+4]). If biopsy sites have different GS, taking clinical, pathological and radiological characteristics into account is recommended for patient risk stratification and management. Neither global nor worst ISUP GG is clearly superior over the other [327]. The majority of clinical studies have not specified whether global or worst biopsy grade was taken into account. In addition to GS/ISUP GG, the presence/absence of intraductal/invasive cribriform pattern should be reported [118,324,325]. In addition, in biopsy GS 7 (ISUP GG 2 and 3) percentage Gleason grade 4 should be monitored at the case and/or biopsy level [118,325]. Lymphovascular invasion (LVI), EPE and ejaculatory duct/seminal vesicle involvement must each be reported, if identified, because they carry unfavourable prognostic information [328-330]. Studies on biopsy perineural invasion (PNI) have shown variable outcome. Two systematic reviews and meta-analyses of biopsy PNI showed independent association with PSM and BCR in men who underwent RP [331,332].
A series of studies have demonstrated that computer-assisted PCa grading AI algorithms can perform grading at the level of experienced genitourinary pathologists. These algorithms have potential in supporting grading of less experienced pathologists by reducing interobserver variability and in quantitative analyses. However, more extensive and prospective validation of these algorithms is needed for implementation in daily clinical practise [118,324,325,333,334]. The proportion of systematic (nontargeted) carcinoma-positive cores as well as the extent of tumour involvement per biopsy core correlate with the ISUP GG, tumour volume, surgical margins and pathological stage in RP specimens and predict BCR, post-prostatectomy progression and RT failure. These parameters are included in nomograms created to predict pathological stage and SV invasion after RP and RT failure [335,336]. A pathology report should therefore provide both the number of carcinoma positive cores and the extent of cancer involvement for each core. The length in millimetres and percentage of carcinoma in the biopsy have equal prognostic impact [337].
5.3.2.b. Recommended item list for reporting prostate cancer biopsies [118,324,325]
| Recommended item list |
| Type of carcinoma |
| Primary and secondary Gleason grade per biopsy site and International Society of Urological Pathology (ISUP) GG |
| Percentage of Gleason grade 4 in Gleason Score (GS) 7 biopsies |
| Presence/absence of intraductal/invasive cribriform carcinoma |
| Presence of Atypical Intraductal Proliferation (AIP) in intraductal/invasive cribriform-negative cases |
| Number of cancer-positive biopsy cores |
| Extent of cancer (in mm or percentage) |
| For MRI-targeted biopsies with multiple cores aggregate (or composite) ISUP GG per lesion |
| For carcinoma-negative MRI-targeted biopsy, specific benign pathology, e.g. fibromuscular hyperplasia or granulomatous inflammation |
| If present, lymphovascular invasion (LVI), extraprostatic extension and ejaculatory duct/seminal vesicle involvement |
5.3.3. Tissue-based prognostic biomarker testing
After a comprehensive literature review and several panel discussions, an American Society of Clinical Oncology (ASCO)-EAU-American Urological Association (AUA) multidisciplinary expert panel issued recommendations regarding the use of tissue-based PCa biomarkers [338]. The recommendations were limited to five commercially available tests (Oncotype Dx, Prolaris, Decipher, Decipher PORTOS and ProMark) with extensive validation in large retrospective studies and evidence that their test results might impact clinical decision-making. The selected commercially available tests significantly improved the prognostic accuracy of clinical, multivariable models for identifying men who would benefit from AS and those with csPCa requiring curative treatment, as well as for guidance of patient management after RP. Few studies showed that tissue biomarker tests and MRI findings independently improved the detection of csPCa in an AS setting, but it remains unclear which men would benefit from both tests. Decipher® test outcome has been associated with presence of intraductal/invasive cribriform carcinoma but retains independent value in multivariable analysis. Since the long-term impact of the use of these commercially available tests on oncological outcome remains unproven and prospective trials are largely lacking, the Panel concluded that these tests should not be offered routinely, but only in subsets of patients for which the test result provides clinically actionable information. This includes, for example, men with favourable intermediate-risk PCa who might opt for AS or men with unfavourable intermediate-risk PCa scheduled for RT to decide on treatment intensification with hormone therapy (HT) [339]. Since then, data from a RCT including 215 patients with intermediate risk PCa randomised to two different radiotherapy doses, and with a median follow-up of 12.8 years, showed that a Decipher® test indicating high risk proved to be prognostic for disease progression (HR 1.12), biochemical failure (HR 1.22), distant metastasis (HR 1.28) and PCSM (HR 1.45) [340]. However, because the endpoint was secondary and the study was designed for a completely different purpose, the recommendations remain unchanged until the findings have been confirmed. There are several other potential biomarkers, both on the market and in development, but the evidence to support a clinical benefit sufficient for guideline inclusion is not yet available.
5.3.4. Tissue samples for homologous recombination repair (HRR) testing
Homologous recombination repair testing in the PROfound trial was conducted on archival or recent biopsy tissue from primary or metastatic disease with successful sequencing in 69% [341]. Alterations in HRR genes are relatively unchanged, comparing matched treatment-naïve diagnostic and mCRPC biopsies [342,343]. Whereas there is no preference for the use of archival or new metastatic biopsies for HRR testing, bone biopsies might be associated with lower success rates related to decalcification of tissue [344]. Testing of circulating tumour DNA might be a good alternative if tumour tissue is not available [343,345]. With tissue as reference, ctDNA showed 81% positive and 92% negative percentage agreement [346].
5.3.5. Histopathology of radical prostatectomy specimens
5.3.5.a. Processing of radical prostatectomy specimens
Histopathological examination of RP specimens describes the pathological stage, histopathological type, grade and surgical margins of PCa. It is recommended that RP specimens be totally embedded to enable assessment of cancer location, multifocality and heterogeneity. For cost-effectiveness, partial embedding can also be considered, particularly for prostates > 60g. The most widely accepted method includes complete embedding of the posterior prostate and a single mid-anterior left and right section. Compared with total embedding, partial embedding with this method missed 5% of positive margins and 7% of EPE [347].
The entire RP specimen should be inked upon receipt in the laboratory to demonstrate the surgical margins. Specimens are fixed by immersion in buffered formalin for at least 24 hours, preferably before slicing. After fixation, the apex and the base (bladder neck) are removed and cut into sagittal/parasagittal or radial sections; the shave method is not recommended [116]. The remainder of the specimen is cut in transverse, 3-4mm sections, perpendicular to the long axis of the urethra. The resultant tissue slices can be embedded and processed as whole mounts or after quadrant sectioning. Whole mounts provide better topographic visualisation, faster histopathological examination and better correlation with preoperative imaging, although they are more time-consuming and require specialist handling. For routine sectioning, the advantages of whole mounts do not outweigh their disadvantages.
5.3.5.b. Radical prostatectomy specimen report
The pathology report provides essential information on the prognostic characteristics relevant for clinical decision-making (Table 5.3). As a result of the complex information to be provided for each RP specimen, the use of synoptic/synoptic-like or checklist reporting is recommended. Synoptic reporting results in more transparent and complete pathology reporting [348].
Table 5.3: Mandatory elements provided by the pathology report
| Mandatory elements |
| Histopathological (sub)type |
| Type of carcinoma, e.g. conventional acinar adenocarcinoma, (small cell) neuroendocrine cell carcinoma or ductal carcinoma |
| Subtype and unusual variants, e.g. pleomorphic giant cell or mucinous |
| Histological grade |
Primary (predominant) Gleason grade Secondary Gleason grade Tertiary Gleason grade (if applicable) ISUP GG Approximate percentage of Gleason grade 4 or 5 (optional) |
| Tumour quantitation (optional) |
Percentage of prostate involved Size/volume of dominant tumour nodule |
| Pathological staging (pTNM) |
If extraprostatic extension is present:
If applicable, regional lymph nodes:
|
| Surgical margins |
If carcinoma is present at the margin, specify the following:
|
| Other |
Presence of lymphovascular invasion Location of dominant tumour Presence of intraductal carcinoma/cribriform architecture |
5.3.5.c. ISUP GG in prostatectomy specimens
Grading of conventional prostatic adenocarcinoma using the Gleason system is the strongest prognostic factor for clinical behaviour and treatment response [117]. The GS is incorporated in nomograms that predict disease-specific survival (DSS) after prostatectomy [349,350]. The ISUP GG in prostatectomy specimens is generally determined in a manner similar to that in biopsies, with a minor exception, i.e. the exclusion of minor (< 5%) high-grade components from the ISUP GG. For instance, in a carcinoma almost entirely composed of Gleason grade 3, the presence of a minor (< 5%) Gleason grade 4 or 5 component is not included in the GS (ISUP GG 1), but its presence is commented upon [118]. In case of multifocality, the ISUP GG of the index lesion (i.e. the tumour having the highest grade, stage or volume) is specified.
5.3.5.d. Definition of extraprostatic extension
Extraprostatic extension is defined as carcinoma mixed with periprostatic adipose tissue, or tissue that extends beyond the prostate gland boundaries (e.g. neurovascular bundle, anterior prostate). Microscopic bladder neck invasion is considered EPE. It is useful to report the location and extent of EPE for surgical and radiological quality assurance. While extent of EPE has been associated with recurrence risk in some studies [351], a systematic review and meta-analysis did not find a statistically significant difference between focal and extensive EPE for BCR-free survival [352]. There are no internationally accepted definitions of focal or microscopic versus nonfocal or extensive EPE. Some describe focal as a few glands [353] or <1 high-power field in one, or at most two sections, whereas others measure the depth of extent in millimetres [353]. At the apex of the prostate, tumour mixed with skeletal muscle does not constitute EPE. In the bladder neck, microscopic invasion of smooth muscle fibres is not equated to bladder wall invasion, i.e. not as pT4, because it does not carry independent prognostic significance for PCa recurrence and should be recorded as EPE (pT3a) [354,355]. Stage pT4 is assigned when the tumour invades the bladder muscle wall as determined macroscopically [109].
5.3.5.e. PCa volume
Although PCa volume at RP correlates with tumour grade, stage and surgical margin status, the independent prognostic value of PCa volume has not been established [353,356,357]. Improvement in prostatic radio imaging enables more accurate preoperative measurement of cancer volume. Since the independent value of pathological tumour volume at RP has not been established, reporting of the diameter/volume of the dominant tumour nodule, or a rough estimate of the percentage of cancer tissue, is optional [358].
5.3.5.f. Surgical margin status
Surgical margin status is an independent risk factor for BCR. Margin status is positive if tumour cells are in contact with the ink on the specimen surface. Margin status is negative if tumour cells are close to the inked surface [359] or at the surface of the tissue lacking ink. In tissues that have severe crush artefacts, it may not be possible to determine margin status [360]. Surgical margin is separate from pathological stage, and a positive margin is not evidence of EPE [361]. There is evidence of a relationship between margin extent and recurrence risk [362,363]. A systematic review including 16 retrospective studies showed that positive surgical margin length measured either as continuous or dichotomised (< 3mm vs. > 3mm, < 1mm vs. > 1mm) variable was an independent prognostic parameter for BCR-free survival [364]. Some indication must be provided of the multifocality and extent of margin positivity, such as the linear extent in millimetres of involvement: focal, ≤ 1mm vs. extensive, > 1mm [365], or number of blocks with positive margin involvement. The Gleason score at the positive margin was found to correlate independently with outcome and should be reported [348,362,366].
5.3.5.g. Rare aggressive PCa (sub)types
While acinar and ductal adenocarcinoma are, by far, the most common types of PCa, other rare aggressive PCa types and subtypes are recognised. Neuroendocrine transformation can occur as small cell, large cell or amphicrine (synonym: adenocarcinoma with diffuse neuroendocrine differentiation) carcinoma. (Adeno)squamous, sarcomatoid and pleomorphic giant cell carcinoma are all exceedingly rare. These (sub)types of PCa are predominantly found in the CRPC setting, but can also occur at primary diagnosis. Respective subtypes together with adenoid cystic (basal cell) carcinoma have limited sensitivity to androgen-deprivation therapies, and should be differentiated from unrelated primary tumours originating from other organs.
5.4. Biopsy indication
5.4.1. Risk assessment before MRI and biopsy
An elevated risk of significant PCa is established based on one or more of the primary diagnostic tools applied, such as PSA level, other serum biomarker, DRE or primary imaging. While in the classic diagnostic algorithm the indication for biopsy was generally solely based on a PSA threshold or abnormal DRE, different two- or three-tier sequential/conditional pathways are now available to indicate prostate biopsy, such as imaging and/or biomarkers. These can be combined and/or sequenced into two-tier or multitier conditional diagnostic pathways (e.g. PSA -> MRI, PSA -> risk calculator, PSA -> risk calculator -> MRI, and so on). Age, comorbidity, life expectancy and therapeutic consequences should also be considered and discussed beforehand [243].
The chosen diagnostic algorithm can be elected based on availability, expertise and resources. The various approaches impact cancer detection rates, number of (un)necessary biopsies, number of patient visits and option of targeted biopsies. The elected strategy can also be decided based on prevalence of disease in men entering the pathway (e.g. screening versus clinical symptoms).
Different sequences and combinations of these tools lead to different rates of biopsy indications and detection rates of insignificant PCa and significant PCa, but also on the burden and costs of the diagnostic algorithm [367].
For re-evaluation of the initial PSA value and the use of PSA-D in risk assessment before MRI, see Sections 5.2.2 and 5.2.3).
5.4.1.a. Risk calculators assessing the risk of csPCa
At different steps during the diagnostic process, available parameters may be combined into risk calculators to optimise risk assessment of csPCa. Validation and adaption to the target population are critical issues before use. Risk calculators which combine clinical data (age, DRE findings, PSA level, prostate volume, etc.) may be useful in helping to determine (on an individual basis) what the potential risk of cancer may be, thereby improving the balance of the cancer detection rates and number of biopsies [368].
Several tools developed as a result of cohort studies are available, including (among others) the calculator derived from the ERSPC cohort (http://www.prostatecancer-riskcalculator.com/seven-prostate-cancer-risk-calculators) that has been updated by incorporating the 2014 ISUP Pathology Gleason Grading and Cribriform growth [181], and the calculator derived from the Prostate Cancer Prevention Trial (PCPT) cohort (PCPTRC 2.0 http://myprostatecancerrisk.com). However, calculators are limited by their dependency on disease prevalence. All calculators show miscalibration when tested in populations with a different prevalence than that of the training population of the model. Recalibrations taking into account the local prevalence are possible, but this approach is difficult in routine practice, because the local prevalence is difficult to estimate and may change over time. In an SR initiated by the ‘Prostate Cancer Awareness and Initiative for Screening in the European Union’ (PRAISE-U) group all currently available risk calculators are listed. The SR underscores the need for updates, validation and adaption of risk calculators to accommodate local differences in patient population [215]. Available risk calculators which have been externally validated ≥ 5 times are listed in Table 5.4.
Table 5.4 Available risk calculators assessing the risk of csPCa (externally validated five or more times)
| Available risk calculators with ≥ 5 external validations before MRI | ||
| AUC (aggregated) | Factors included | |
| PBCG RC | 0.70 | PSA, DRE, Age, PBx, FH, BMI |
| RPCRC-RC3/4 | 0.75 | PSA, DRE, PBx, PV |
| RPCRC-RC3 | 0.78 | PSA, DRE, PBx, PV |
| PCPTRC 2.0 | 0.69 | PSA, DRE, Age, PBx, FH, BMI |
| RPCRC-RC3/4-DRE | 0.74 | PSA, DRE, PBx, PV |
| PCPTRC | 0.70 | PSA, DRE, Age, PBx, FH, BMI |
| Including blood biomarker | ||
| 4Kscore Test | 0.82 | tPSA, fPSA, iPSA, hK2, PSA, DRE, Age, PBx |
| Stockholm3 model | 0.80 | fPSA, GDG15, PSP94, fhK2, 101 SNPs, PSA, DRE, Age, PBx, PV, FH |
| After MRI | ||
| MRI-RPCRC-RC3/4 | 0.82 | PSA, DRE, PBx, PV, TRUS, PIRADS |
| Van Leeuwen | 0.86 | PSA, DRE, PBx, PV, PI-RADS |
| Radtke | 0.83 | PSA, DRE, Age, PV, PI-RADS |
| Mehralivand | 0.82 | DRE, Age, PBx, PV, Race, PSA-D, PI-RADS |
BMI = body mass index; DRE = digital rectal exam; FH = family history; fPSA = free PSA; iPSA = initial PS; PBx = prior biopsy; PI-RADS = Prostate Imaging-Reporting and Data System; PSA = prostate specific antigen; PSA-D = PSA density; PV = prostate volume; tPSA = total PSA; TRUS = transrectal ultrasound.
5.4.1.b. Using risk stratification to avoid magnetic resonance imaging scans and biopsy procedures
Use repeated PSA if the initial PSA is between 3 and 10ng/mL and use PSA-D in risk stratification (see Sections 5.2.2 and 5.2.3).
A retrospective analysis including 200 men from a prospective database of patients who underwent MRI and combined systematic and targeted biopsy showed that upfront use of the Rotterdam Prostate Cancer Risk Calculator would have avoided MRI and biopsy in 73 men (37%). Of these 73 men, ten had ISUP GG 1 cancer and four had ISUP GG ≥ 2 cancer [369]. A prospective multicentre study evaluated several diagnostic pathways in 545 biopsy-naïve men who underwent MRI and systematic and targeted biopsy. Using a PHI threshold of > 30 to perform MRI and biopsy would have avoided MRI and biopsy in 25% of men, at the cost of missing 8% of the ISUP GG ≥ 2 cancers [370]. Another prospective multicentre trial including 532 men (with or without history of prostate biopsy) showed that using a threshold of ≥ 10% for the Stockholm3 test to perform MRI and biopsy would have avoided MRI and biopsy in 38% of men, at the cost of missing 8% of ISUP GG ≥ 2 cancers [286]. Finally, a risk calculator developed on 1,486 men who underwent MRI and biopsy was externally validated on a cohort of 946 men from two institutions. Using a risk threshold that provided 95% sensitivity in the development cohort could have avoided 22% of the MRI scans in the validation cohort while missing 5% of csPCa [371].
In conclusion, as long as patients with a low risk score on the risk calculator are offered repeat testing and follow-up until they have a life expectancy of < 15 years, it seems unlikely that any preliminary missed case would cause increased morbidity or lead to PCSM.
5.4.2. MRI-based indication for biopsy
5.4.2.a. MRI as a triage test for biopsy (‘MRI pathway’)
Owing to its high sensitivity, MRI showed an excellent NPV for ruling out the presence of csPCa, not only at subsequent biopsy [372], but also after four years of follow-up [373,374].
The diagnostic yield and number of biopsy procedures potentially avoided by MRI triage depends on the Likert/PI-RADS threshold used to define a positive MRI. In a meta-analysis on PI-RADS v2.1 data [229], PI-RADS ≥ 3 thresholding showed MRI sensitivity/specificity for significant disease of 96%/43% on a patient level for ISUP GG ≥ 2 cancer (15 reports, 4,484 men), while PI-RADS ≥ 4 thresholding showed sensitivity/specificity of 88%/64% (21 reports, 5,745 men). On a patient level, the distribution of PI-RADS categories was PI-RADS 1: 9%, PI-RADS 2: 29%, PI-RADS 3: 19%, PI-RADS 4: 22%, and PI-RADS 5: 19%, suggesting a potential biopsy reduction of 38% when thresholding at PI-RADS ≥ 3.
In pooled studies on biopsy-naïve patients and patients with prior negative biopsies, a Likert/PI-RADS threshold of ≥ 3 would have avoided 30% (95% CI: 23-38) of all biopsy procedures while missing 11% (95% CI: 6-18) of all detected ISUP GG ≥ 2 cancers (relative percentage) [226]. Increasing the threshold to ≥ 4 would have avoided 59% (95% CI: 43-78) of all biopsy procedures while missing 28% (95% CI: 14-48) of all detected ISUP GG ≥ 2 cancers [226]. Of note, the percentages of negative MRI (Likert/PI-RADS score ≤ 2) may show substantial variability among series (between 21-49%) [135,264,375].
In the MR PROPER trial - a prospective, multicentre, non-randomised opportunistic early detection setting (PSA > 3ng/mL) - comparable rates of ISUP GG ≥ 2 cancer detection (24% vs. 25%) were obtained by the MRI pathway and by a strategy indicating systematic biopsy based on a risk calculator [376]. However, the MRI pathway avoided biopsy in more men as compared to the diagnostic pathway using a risk calculator (559/1015, 55% vs. 403/950, 42%; difference -13%, 95% 27 CI: -17% to -8.3%; p < 0.01). It also detected fewer ISUP GG 1 cancers (84/1015, 8.3% vs. 121/950, 13%; difference 4.5%, 95% CI: 1.8-7.2%; p < 0.01) [376]. As a result of testing lower-risk men in current practice (i.e., opportunistic setting), a higher rate of prostate biopsies can be avoided by MRI triage.
5.4.2.b. Combining MRI and PSA Density
Prostate-specific antigen density (PSA-D) may help refine the risk of csPCa in patients undergoing MRI as PSA-D and the PI-RADS score are significant independent predictors of csPCa at biopsy [377,378]. Combinations of PSA-D and MRI have been explored [230,379], showing guidance in biopsy decisions whilst safely avoiding redundant biopsy testing and detection of insignificant PCa. In a meta-analysis of eight studies, pooled MRI NPV for ISUP GG ≥ 2 cancer was 84% (95% CI: 81-87) in the entire cohort, 83% (95% CI: 80-84) in biopsy-naïve men and 88% (95% CI: 85-91) in men with prior negative biopsies. In the subgroup of patients with PSA-D < 0.15ng/mL/cc, NPV increased to 90% (95% CI: 87-93), 89% (95% CI: 83-93) and 94% (95% CI: 91-97), respectively [380]. In contrast, the risk of ISUP GG ≥ 2 cancer is as high as 27-40% in patients with negative MRI and PSA-D > 0.15-0.20ng/mL/cc [375,378,379,381-383].
Based on a meta-analysis of > 3,000 biopsy-naïve men, a risk-adapted data table of csPCa was developed, linking PI-RADS score (1-2, 3, and 4-5) to PSA-D categories (< 0.10, 0.10-0.15, 0.15-0.20 and > 0.20ng/mL) (Table 5.5) [230]. This risk-adapted matrix table may guide the decision to perform a biopsy. The safety of this risk-based biopsy guidance was confirmed by a cohort study of 2,055 biopsy-naïve men [384].
In a multicentre retrospective cohort of 1,476 men with PIRADS 3 lesions and a prevalence of 18.5% of ISUP GG ≥ 2 cancer, age, prior negative biopsy and PSA-D were significant independent predictors of the presence of ISUP GG ≥ 2 cancer at subsequent systematic and targeted biopsy. Applying a PSA-D cut-off of 0.15ng/mL/cc, 817 biopsy procedures (58.4%) would have been avoided, at the cost of missing ISUP GG ≥ 2 cancer in 91 men (6.5%), while ISUP GG 1 cancer would not have been detected in 115 men (8.2%) [385]. Two studies provided follow-up data for patients with PI-RADS scores of 1-3 and PSA-D < 0.15ng/ml/cc for whom biopsy was omitted. The cumulative incidence of ISUP GG ≥ 2 cancer detection was 1.3% at two years [386] and 3.2% at 36 months [387].
Table 5.5: Risk data table of clinically significant prostate cancer related to PI-RADS score and PSA D categories in biopsy-naïve men clinically suspected of having significant disease [230]*
| Detection of clinically significant prostate cancer (ISUP GG 2 and higher) | |||||
| PSA-density risk groups | |||||
| PI-RADS risk categories | Prevalence ISUP GG ≥ 2 PCa | Low < 0.10 | Intermediate-low 0.10-015 | Intermediate-high 0.15-0.20 | High > 0.20 |
31% (678/2199) | 28% (612/2199) | 16% (360/2199) | 25% (553/2199) | ||
| Compiled totals of csPCa risk | |||||
| PI-RADS 1-2 | 6% (48/839) | 3% (11/411) | 7% (17/256) | 8% (8/104) | 18% (12/68) |
| PI-RADS 3 | 16% (41/254) | 4% (3/74) | 13% (11/88) | 29% (12/41) | 29% (15/51) |
| PI-RADS 4-5 | 62% (687/1106) | 31% (59/189) | 54% (144/286) | 69% (148/215) | 77% (336/434) |
| All PI-RADS | 35% (776/2199) | 11% (73/674) | 28% (172/612) | 47% (168/360) | 66% (363/553) |
| Risk-adapted matrix table for biopsy decision management | |||||
| PI-RADS 1-2 | No biopsy | No biopsy | No biopsy | Consider biopsy | |
| PI-RADS 3 | No biopsy | Consider biopsy | Strongly consider biopsy | Perform biopsy | |
| PI-RADS 4-5 | Perform biopsy | Perform biopsy | Perform biopsy | Perform biopsy | |
| Risk % | |
| Very low | 0-5% csPCa (below population risk) [194]. |
| Low | 5-10% csPCa (acceptable risk) |
| Intermediate-low | 10-20% csPCa |
| Intermediate-high | 20-30% csPCa |
| High | 30-40% csPCa |
| Very high | > 40% csPCa |
*Table adapted from: Schoots, IG and Padhani AR. BJU Int 2021 127(2):175. Risk-adapted biopsy decision based on prostate magnetic resonance imaging and prostate-specific antigen density for enhanced biopsy avoidance in first prostate cancer diagnostic evaluation, with permission from Wiley.
5.4.2.c. Risk calculators incorporating MRI findings
Several groups have developed comprehensive risk calculators that combine MRI findings with simple clinical data as a tool to predict subsequent biopsy results [388]. Some calculators underwent external validation with good results both in terms of discrimination and clinical utility and tended to outperform risk calculators not incorporating MRI findings [389-393]. However, their use is hindered by their miscalibration due to prevalence dependency (see Section 5.4.1.a).
5.4.2.d. MRI in population-based screening protocols
MRI as a sequential screening tool following PSA
A meta-analysis comparing the use of PSA followed by MRI (sequential) with PSA-only screening methods in terms of clinically significant CDR did not show any significant difference when thresholding at PI-RADS ≥ 3 (OR: 1.02 [0.75-1.37]; p = 0.86) [173]. However, the MRI pathway was associated with lower odds of insignificant PCa detection (OR: 0.34 [0.23-0.49]; p = 0.002). Moreover, MRI and MRI-sequential screening methods had a higher PPV for detecting significant PCa (OR: 4.15 [2.93-5.88]; p = 0.001) and a lower biopsy rate (OR: 0.28 [0.22-0.36]; p < 0.001) than PSA-only-based methods. Thresholding at PI-RADS ≥ 4 showed even lower odds of insignificant PCa detection (OR: 0.23; 95% CI: 0.05-0.97; p = 0.048) and biopsy (OR: 0.19; 95% CI: 0.09-0.38; p = 0.01), with a higher PPV (OR: 7.01; 95% CI: 1.76-27.98; p = 0.03) and similar clinically significant CDR (OR: 0.85; 95% CI: 0.49-1.45; p = 0.23) compared with standard PSA-only screening [173].
For second-stage MRI, the frequency of indeterminate MRI results (MRI score 3) was observed in approximately 20% of second-stage MRI screening interpretations (range 8-43%); and the frequency of scores of 1 or 2 was approximately 60% (e.g. OPT 59%; STHLM3-MRI 56%; Göteborg-2 control arm 59%; and Göteborg-2 experimental arm 61%) [395-398]. Therefore, in a population-based screening setting, the ‘MRI pathway’ may reduce the risk of overdiagnosis by two thirds, without substantially compromising clinically significant tumours. However, these results were obtained at single academic centres with double reading of the MRI, which may limit their generalisability in less experienced centres (see Section 5.5.5).
MRI as a first-line screening tool
Studies have suggested a role for MRI as a first-line screening tool with the aim of detecting csPCa even at PSA levels below the commonly adopted thresholds. However, the frequency of negative MRI results is higher in first-line MRI screening compared to second-line triage (range, 66-89%) [399-403]. Thresholding at a PI-RADS ≥ 4 in MRI as the primary screening tool, clinically significant and insignificant CDRs were 6% [0.6-39%] and 1.2% [0.2-7%], respectively [399,404,405]. The PPV of upfront MRI to detect significant PCa was 42% [16-73%].
The GG ≥ 2 cancer detection rates in MRI-positive men undergoing targeted and systematic biopsies were generally higher in second-stage MRI screening than in first-line MRI screening (range, 31-62% vs. 22-27%), likely due to the higher disease prevalence due to PSA preselection [395]. The wide variation in GG ≥ 2 cancer detection rates across studies cannot be explained solely by differences in MRI utilisation and MRI-targeted biopsy approaches. Age differences in study inclusion and differences in PSA positivity also contributed by affecting the GG ≥ 2 cancer prevalence.
5.4.3. Micro-US-based indication for biopsy
High-resolution micro-US-guided biopsy can complement MRI fusion-guided biopsy for PCA diagnosis. The OPTIMUM trial, a multicentre, international, open-label, randomised, non-inferiority trial of biopsy-naïve patients, compared micro-US-guided and MRI fusion-guided biopsy in patients with clinical suspicion of PCa (elevated PSA and/or abnormal DRE findings) [270]. Patients were randomised in a 1:2:3 ratio to undergo micro-US-guided biopsy without MRI (micro-US), combined MRI/micro-US fusion-guided biopsy (micro-US/MRI), or software-assisted MRI/conventional US fusion-guided biopsy (MRI/conUS). The primary outcome was the difference in detection of GG 2 or higher cancers using micro-US-guided plus systematic biopsy versus MRI/conUS-guided plus systematic biopsy.
Grade group 2 or higher cancer was detected in 57 participants (47%) in the microUS group, in 141 (43%) in the MRI/conUS group, and in 106 (47%) in the micro-US/MRI group. Micro-US-guided biopsy was non-inferior to MRI fusion-guided biopsy (difference, 3.5% [95% CI: −3.95% - 10.92%]; non-inferiority p < .001; non-inferiority margin set at 10%). Combined biopsy with micro-US/MRI was also non-inferior to MRI/conUS-guided biopsy (difference, 4.3% [95% CI: −4.06% to 12.63%]; non-inferiority p < .001). Grade group 2 or higher cancer diagnosed by targeted biopsy only was 38% in the micro-US group, 34% in the MRI/conUS group, and 40% in the micro-US/MRI group; these differences were not significant. Of note, 20% of the patients who had micro-US had negative findings (PIRIMUS 1-2), while 32% of patients who underwent MRI had negative findings (PI-RADS 1-2) suggesting that the micro-US pathway could avoid less biopsies than the MRI pathway [270]. Another prospective trial found similar results [267].
5.5. Biopsy strategy
Prostate biopsy can be performed using various strategies (systematic, targeted, etc.) and approaches (i.e. transperineal versus transrectal).
5.5.1. Systematic biopsy strategy
For systematic biopsies in which no prior imaging is used for targeting, the sample sites should be bilateral from apex to base, as far posterior and lateral as possible in the peripheral gland, regardless of the approach used. A 2006 SR showed that 12 is the minimum number of cores for systematic biopsies, with > 12 cores not increasing cancer detection rate significantly [406].
5.5.2. Targeted biopsy strategy
Where MRI has shown a suspicious lesion, MR-targeted biopsy can be obtained through cognitive guidance, US/MR fusion software or direct in-bore guidance. Current literature, including SRs and meta-analyses, does not show a clear superiority of one image-guided technique over another [407-409]. The Target Biopsy Techniques Based on Magnetic Resonance Imaging in the Diagnosis of Prostate Cancer in Patients with Prior Negative Biopsies (FUTURE) randomised trial compared three techniques (cognitive fusion, software fusion and in-bore MRI) of MRI-targeted biopsy in the repeat-biopsy setting and found no differences in cancer detection [408]. However, it was underpowered for this conclusion.
5.5.3. Targeted biopsy versus systematic biopsy
5.5.3.a. Increased detection of cancers labelled as clinically significant
The PRECISION (Prostate Evaluation for Clinically Important Disease: Sampling Using Image Guidance or Not?) [135] and PRECISE (Prostate Evaluation for Clinically Important Disease: MRI vs. Standard Evaluation Procedures) [410] prospective trials randomised biopsy-naïve patients to either ten- to twelve-core systematic biopsy or to MRI with subsequent MRI-targeted biopsy (up to four cores) in case of positive MRI. These trials found that MRI-targeted biopsy significantly outperformed [135] or was not inferior to [410] systematic biopsy for the detection of ISUP GG ≥ 2 cancers. In pooled data of 25 reports on agreement analysis (head-to-head comparisons) between systematic biopsy (median number of cores: 8-15) and MRI-targeted biopsies (median number of cores: 2-7), the detection ratio (i.e. the ratio of the detection rates obtained by MRI-targeted biopsy alone and by systematic biopsy alone) was 1.12 (95% CI: 1.02-1.23) for ISUP GG ≥ 2 cancers and 1.20 (95% CI: 1.06-1.36) for ISUP GG ≥ 3 cancers, and therefore in favour of MRI-targeted biopsy [168]. Another meta-analysis of studies limited to biopsy-naïve patients with a positive MRI also found that MRI-targeted biopsy detected significantly more ISUP GG ≥ 2 cancers than systematic biopsy (risk difference, -0.11 [95% CI: -0.2-0.0]; p = 0.05) [411]. This data was further confirmed in another prospective multicentre trial [412].
In a subgroup of 152 patients from the FUTURE trial who underwent both MRI-targeted biopsy and systematic biopsy in a repeat biopsy setting, MRI-targeted biopsy detected significantly more ISUP GG ≥ 2 cancers than systematic biopsy (34% vs. 16%; p < 0.001, detection ratio of 2.1) [413]. These findings support the claim that MRI-targeted biopsy significantly outperforms systematic biopsy for the detection of ISUP GG ≥ 2, including in the repeat-biopsy setting.
5.5.3.b. Reduced detection of cancers labelled ISUP GG 1
In pooled data of 25 head-to-head comparisons between systematic biopsy and MRI-targeted biopsy, the detection ratio for ISUP GG 1 cancers was 0.62 (95% CI: 0.44-0.88) in patients with prior negative biopsy and 0.63 (95% CI: 0.54-0.74) in biopsy-naïve patients [226]. In the PRECISION and 4M trials, the detection rate of ISUP GG 1 patients was significantly lower in the MRI-targeted biopsy group as compared to systematic biopsy (9% vs. 22%, p < 0.001, detection ratio of 0.41 for PRECISION; 14% vs. 25%, p < 0.001, detection ratio of 0.56 for 4M) [135,375]. In the MRI-FIRST trial, MRI-targeted biopsy detected significantly fewer patients with clinically insignificant PCa (defined as ISUP GG 1 and maximum cancer core length < 6 mm) than systematic biopsy (5.6% vs. 19.5%, p < 0.0001, detection ratio of 0.29) [264]. Consequently, MRI-targeted biopsy without systematic biopsy significantly reduces overdiagnosis of low-risk disease compared to systematic biopsy. This seems true even when systematic biopsies are indicated after risk stratification with the Rotterdam Prostate Cancer Risk Calculator) [376].
5.5.3.c. Added value of systematic biopsy and targeted biopsy
From head-to-head comparisons between the two biopsy techniques, it is possible to compute their added value, i.e. the percentage of additional patients with csPCa they help diagnose. Table 5.6 shows the added value of systematic and MRI-targeted biopsy for ISUP GG ≥ 2 and ≥ 3 cancer detection. The absolute added values in the table refer to the percentage of patients in the entire cohort. If the cancer prevalence is considered, the ‘relative’ percentage of additional detected csPCa can be calculated. Adding MRI-targeted biopsy to systematic biopsy in biopsy-naïve patients increases the number of detected ISUP grade ≥ 2 and grade ≥ 3 PCa by approximately 20% and 30%, respectively. In the repeat-biopsy setting, adding MRI-targeted biopsy increases detection of ISUP GG ≥ 2 and GG ≥ 3 PCa by approximately 40% and 50%, respectively. Omitting systematic biopsy in biopsy-naïve patients would miss approximately 16% of all detected ISUP GG ≥ 2 PCa and 18% of all ISUP grade ≥ 3 PCa. In the repeat-biopsy setting, it would miss approximately 10% of ISUP GG ≥ 2 PCa and 9% of ISUP GG ≥ 3 PCa. The low added value of systematic biopsy in the repeat biopsy setting has been further confirmed by other studies that reported absolute added values of 1.2-3.9% for the detection of ISUP GG ≥2 cancers and of 1.2-1.6% for ISUP GG ≥ 3 cancers [413-415].
Table 5.6: Absolute added values of targeted and systematic biopsies for ISUP grade ≥ 2 and ≥ 3 Cancer Detection
| ISUP GG ≥ 2 | ISUP GG ≥ 3 | ||||||
| ISUP grade | Cochrane meta-analysis* [226] | MRI-FIRST trial* [264] | 4M trial [375] | Cochrane meta-analysis* [226] | MRI-FIRST trial* [264] | 4M trial [375] | |
| Biopsy-naïve | Added value of MRI-TBx | 6.3% (4.8-8.2) | 7.6% (4.6-11.6) | 7.0% (ND) | 4.7% (3.5-6.3) | 6.0% (3.4-9.7) | 3.2% (ND) |
| Added value of systematic biopsy | 4.3% (2.6-6.9) | 5.2% (2.8-8.7) | 5.0% (ND) | 2.8% (1.7-4.8) | 1.2% (0.2-3.5) | 4.1% (ND) | |
| Overall prevalence | 27.7% (23.7-32.6) | 37.5% (31.4-43.8) | 30% (ND) | 15.5% (12.6-19.5) | 21.1% (16.2-26.7) | 15% (ND) | |
| Prior negative biopsy | Added value of MRI-TBx | 9.6% (7.7-11.8) | - | - | 6.3% (5.2-7.7) | - | - |
| Added value of systematic biopsy | 2.3% (1.2-4.5) | - | - | 1.1% (0.5-2.6) | - | - | |
| Overall prevalence | 22.8% (20.0-26.2) | - | - | 12.6% (10.5-15.6) | - | - | |
*Intervals in parenthesis are 95% CI. The absolute added value of a given biopsy technique is defined by the percentage of patients of the entire cohort diagnosed only by this biopsy technique.
ISUP = International Society of Urological Pathology (grade); MRI-TBx = magnetic resonance imaging-targeted biopsies; ND = not defined.
Table 5.7: Detection rates of ISUP GG 1 cancers by targeted and systematic biopsies
| Study | Targeted biopsy | Systematic biopsy | p-value |
| PRECISION [135] | 9% | 22% | <0.001 |
| PRECISE [410] | 10.1 | 21.7 | <0.001 |
| MRI-FIRST [264]* | 5.6% | 19.5% | <0.0001 |
| 4M [375] | 14% | 24.7% | <0.0001 |
| Cochrane meta-analysis [226] | 13.5% | 22.4% | <0.01 |
* In the MRI-FIRST trial, the percentages refer to the detection rates of ISUP GG 1 cancers with a maximum cancer core length < 6 mm.
5.5.4. Perilesional biopsy
A minimum of three to five cores is required for proper sampling of an MRI-detected lesion [237,415,416]. Several concordant studies showed that, in case of a unilateral MRI lesion, contralateral systematic biopsy (i.e., from the MRI-negative lobe) has little added value for diagnosing csPCa (0.3-4%). Paradoxically, the added value of ipsilateral systematic biopsy is higher (4.9-18.4%) and comes mostly from the systematic cores obtained in the sextant containing the MR lesion, or the sextant immediately adjacent [417-421]. Consequently, including additional perilesional/regional systematic biopsies, rather than standard sextant-based systematic biopsies may decrease the total number of cores taken (by avoiding systematic biopsies in MRI-negative lobes) and improve the detection of csPCa (by compensating for guiding imprecision). In addition, the MRI-targeted and regional biopsy approach could avoid detecting 12-17% of the insignificant cancers detected by the classical combined approach [422-424].
A meta-analysis of eight studies showed a non-significant difference in detection of ISUP GG ≥ 2 cancer in the MRI-directed, targeted and regional biopsy approach, compared to the recommended practice of MRI-directed targeted and systematic biopsy approach (RR: 0.95, 95% CI: 0.90–1.01; p = 0.09). However, the MRI-directed targeted and regional biopsy approach detected significantly more ISUP GG ≥ 2 cancers than MRI-targeted biopsy alone (RR: 1.18, 95% CI: 1.10–1.25; p < 0.001) [425].
A meta-analysis of 21 studies also supported the targeted and regional biopsy approach as a valuable strategy for the detection of ISUP GG ≥ 2 cancer in MRI-visible lesions while avoiding overdiagnosis of ISUP GG 1 cancer [426]. The overall GG ≥ 2 cancer detection yield of the reference group was 46% and 44% in the targeted and regional biopsy approach (OR: 1.07, 95% CI: 0.99–1.16, p = 0.07). A further subgroup analysis of targeted and ipsilateral biopsies (excluding perilesional biopsies) did not show significant differences in GG ≥ 2 cancer detection (OR: 1.09, 95% CI: 0.98–1.21, p = 0.13). The targeted and regional biopsy approach significantly avoided overdiagnosis of ISUP GG 1 cancer (OR: 1.16, 95% CI: 1.04–1.30, p = 0.008) [426]. However, some aspects still need to be addressed, including standardisation of the number and spatial placements of targeted and perilesional biopsies, its value in equivocal cases (PI-RADS 3 category) as well as the area defining the perilesional zone in relation to the size of the MRI target.
5.5.5. MRI-targeted biopsy reproducibility
The accuracy of MRI-targeted biopsy is also substantially impacted by the experience of the biopsy operator [237]. The PRECISE trial, which reproduced the design of the PRECISION trial, obtained quite different results. In both trials, the detection rate for ISUP GG ≥2 PCa was higher for the MRI pathway than for the classical systematic biopsy pathway. Yet, the difference was much lower in the PRECISE trial (+5.2% vs. +12.1% for ISUP GG ≥ 2 cancers; +2.1% vs. +5.5% for ISUP GG ≥ 3 cancers). In addition, there was major intersite variability in the PRECISE trial: the centre with the highest csPCa detection rate on MRI-targeted biopsy had the lowest csPCa detection rate on systematic biopsy and vice versa [410].
These factors of variability give rise to concerns regarding the reproducibility of the satisfactory results of the MRI-directed diagnostic pathways. Efforts towards standardisation of the entire diagnostic pathway (MRI acquisition and interpretation, biopsy planning and acquisition) through quality assurance and quality control are currently undertaken [237,427]. However, significant improvement in the accuracy of MRI and MRI-targeted biopsy can be observed over time through simple measures such as training and participation to MDT meeting with pathological correlation and feedback [237,428].
5.5.6. MRI-targeted biopsy in younger men (45-55 years)
A post-hoc analysis on the German PROBASE screening trial, suggests that for men between 45 and 55 years, systematic biopsies remain a critical component for cancer detection [177]. While MRI identified 91% (135/148) of all GG ≥ 2 cancers, only 74% (109/148) were detected by transrectal MRI-targeted biopsies. In contrast, 94% (139/148) GG ≥ 2 cancers were detected by concomitant transrectal systematic biopsies. This targeting failure was explained by unfavourable tumour location and small tumours. In terms of tumour location, discrepancies for anterior, apical, and lateral lesions were observed, which are often more difficult to reach via transrectal than transperineal access. Targeting failures for small tumours could potentially be reduced by the perilesional biopsy approach which was not performed during the study. Furthermore, smaller prostate volumes in younger men allow more effective systematic sampling, increasing the yield of the systematic biopsy approach.
MRI did not identify all GG ≥ 2 cancers (91%). A considerable proportion of examinations had PI-RADS 3 findings (46%; 242/525). Owing to the often diffuse signal changes in the T2- and diffusion-weighted imaging with widespread perfusion enhancement in the peripheral zone, cancer detection on MRI is more challenging in younger men [429]. The lack of standardised acquisition and interpretation protocols during the long inclusion period, together with the absence of MRI quality assurance between participating centres, may also have contributed to the high PI-RADS 3 results, rather than the reading challenges in younger men.
5.5.7. Cancer grade shift
MRI findings are significant predictors of adverse pathology features on prostatectomy specimens, and of survival-free BCR after RP or RT [113,430,431]. In addition, tumours visible on MRI are enriched in molecular hallmarks of aggressivity as compared to invisible lesions [231]. MRI, therefore, does in fact identify aggressive tumours.
Nonetheless, because MRI-targeted biopsy is more sensitive than systematic biopsy in detecting areas of high-grade cancer, the prognosis of all risk groups based on the ISUP GG detected by MRI-targeted biopsy is improved as a result of the Will Rogers phenomenon [113]. This grade shift is further aggravated when only the ISUP GG of the most pejorative biopsy core is taken into consideration. Preliminary findings suggest that, when the grade is different between systematic biopsy and MRI-targeted biopsy [432] or between systematic biopsy and prostatectomy specimens [433], the prognosis is intermediate between grades. This is in line with the 2019 ISUP consensus conference which recommended using an aggregated ISUP GG summarising the results of all biopsy cores from the same MR lesion, rather than using the result from the core with the highest ISUP GG [118] (see Section 4.2).
Table 5.8: Detection rates for ISUP GG ≥ 2 prostate cancer achieved by targeted biopsy, combined systematic and targeted biopsy and targeted biopsy with perilesional sampling
| Study | Type of study | N | Targeted biopsy with perilesional sampling vs. Combined systematic and targeted biopsy | Targeted biopsy with perilesional sampling vs. Targeted biopsy | ||
| Ratio of detection rates | Median number of cores | Ratio of detection rates | Median number of cores | |||
| Hagens MJ [425] | Meta-analysis | 2,603 | 0.95 (0.90 - 1.01), p = 0.09 | 9.5 [7.5-12.3] vs. 16.5 15.3 - 12.3] | 1.18 (1.1 - 1.25), p < 0.001 | 9.5 [7.5 - 12.3] vs. 3.5 [3- 4] |
| Hagens MJ [424] | Retrospective, single centre | 235 | 0.968 (0.91 - 0.993) | 7 [6- 9] vs. 12 [10- 15] | - | - |
| Hsieh PF [434] | Prospective, single centre | 100 | 1 | 15 [12.8 - 18] vs. 26 [23- 28] | 1.20, p = 0.008 | 15 [12.8 - 18] vs. 6 [4- 7] |
*Intervals in parenthesis are 95% CI. Intervals in brackets are interquartile ranges.
5.5.8. Recommendations for MRI imaging in biopsy indication and strategy
| Recommendations | Strength rating |
| Do not use magnetic resonance imaging (MRI) as an initial screening tool. | Strong |
| Adhere to PI-RADS guidelines for MRI acquisition and interpretation and evaluate MRI results in multidisciplinary meetings with pathological feedback. | Strong |
| Where MRI has shown a suspicious lesion, MR-targeted biopsy can be obtained through cognitive guidance, ultrasound/MR fusion software or direct in-bore guidance. | Weak |
| Perform MRI before prostate biopsy in male patients with suspected organ-confined disease. | Strong |
| Perform limited biopsy only, without MRI, in males with clear evidence of locally advanced disease on digital rectal examination or those not for curative treatment. | Weak |
| Combine targeted biopsy with perilesional sampling when MRI is positive (i.e. PI-RADS ≥ 4). | Weak |
| Omit biopsy and offer PSA monitoring when MRI is negative (i.e. PI-RADS ≤ 2), and clinical suspicion of PCa is low (PSA density < 0.20 ng/mL/cc and no family history). | Weak |
| When MRI is indeterminate (PI-RADS = 3), and clinical suspicion of PCa is very low (PSA density < 0.10 ng/mL/cc and no family history), omit biopsy and offer PSA monitoring. Otherwise, consider targeted biopsy with perilesional sampling. | Weak |
5.6. Biopsy approach
MRI-directed US-guided prostate biopsy is now the standard of care, although MRI in-bore biopsy is offered in a few centres. MRI-directed US-guided prostate biopsy can be performed using either the transperineal or the transrectal approach. Both can be performed under local anaesthesia [435]. A meta-analysis of nine RCTs including 2,230 patients found that extended biopsy templates (20 vs. 8) showed comparable infectious complications to standard templates (RR: 95% CI: 0.80 [0.53–1.22]) [436]. Additional meta-analyses found no difference in infectious complications regarding needle guide type (disposable vs. reusable), needle type (coaxial vs. noncoaxial), needle size (large vs. small) and number of injections for periprostatic nerve block (standard vs. extended) [436].
5.6.1. MRI-directed transrectal vs transperineal US-guided biopsy
A systematic review and meta-analysis comparing MRI-targeted transrectal (TR) biopsy to MRI-targeted transperineal (TP) biopsy, including eight studies, showed a higher sensitivity for detection of csPCa when the transperineal approach was used (86% vs. 73%) [437]. However, in two subsequent RCTs, csPCa detection was not superior for the TP route compared to TR biopsy [438,439]. The PREVENT trial showed similar csPCa detection for TP (53%) and TR (50%) routes, while the PERFECT trial showed non-inferior csPCa rates for TP (47%) and TR (54%) [438]. Clinically significant PCa detection was different for anterior and posterior tumours [437,440]. The PERFECT trial showed higher significant cancer detection rates for anterior tumours with the TP approach (41% in TP and 27% in TR), while the TR approach favoured posterior tumours (44% in TP and 59% in TR) [440]. These findings were further underlined by pooling the data of prospective trials in a meta-analysis with similar detection rates for PCa, infection, urinary retention and managing pain [441].
The TRANSLATE RCT was designed and powered for detecting a difference in csPCa (ISUP GG ≥ 2) between MRI-guided TP and TR biopsies [442]. In 1,126 men randomised in the study, csPCa rates were 60% in TP and 54% in TR arms (OR 1.32 [95% CI 1.03–1.70]; p=0.031), with less severe adverse events observed in the TP arm. This supports TP as a preferred method over TR in csPCa detection at MRI-guided prostate biopsies.
5.6.2. Local anaesthesia prior to biopsy
Ultrasound-guided periprostatic block is recommended [443]. Intrarectal instillation of local anaesthetic cream is inferior to periprostatic infiltration by injection [444]. Local anaesthesia can also be used effectively for MRI-targeted and systematic transperineal biopsy [445]. Patients are placed in the lithotomy position. Approximately 20mL of lignocaine or bupivacaine with or without adrenaline (1 in 200,000) is injected into the perineal skin and subcutaneous tissues anterior to the anus, followed by a periprostatic block also via transperineal route. A SR evaluating pain in three studies comparing transperineal versus transrectal biopsies found that the transperineal approach significantly increased patient pain (RR: 1.83 [1.27–2.65]) [446]. In a randomised comparison, a combination of periprostatic and pudendal block anaesthesia reduced pain during transperineal biopsies compared to periprostatic anaesthesia only [447]. A novel perineal nerve block was shown in an RCT to be superior for the relief of pain during transperineal biopsy procedure vs. conventional periprostatic block (2.80 vs. 3.98; on 1-10 scale) [448]. Targeted biopsies can then be taken by means of a brachytherapy grid or a freehand needle-guiding device under local infiltration anaesthesia [445,449]. An updated meta-analysis of 28 RCTs with 4,027 patients found no evidence that the use of periprostatic injection of local anaesthesia resulted in more infectious complications than no injection (RR: 95% CI: 1.08 [0.79–1.48]) [436,450,451].
5.6.3. Infection rate after transperineal and transrectal prostate biopsy
A total of eight randomised studies including 1,596 patients compared the impact of the biopsy route on infectious complications. Infectious complications were significantly higher following transrectal biopsy (48 events among 789 men) compared to transperineal biopsy (22 events among 807 men) (RR: 95% CI: 2.48 [1.47–4.2]) [436,450]. In addition, a SR including 165 studies with 162,577 patients described sepsis rates of 0.1% and 0.9% for transperineal and transrectal biopsies, respectively [452]. Finally, a population-based study from the United Kingdom (n = 73,630) showed lower readmission rates for sepsis in patients who had transperineal versus transrectal biopsies (1.0% vs. 1.4%, respectively) [453]. However, two subsequent RCTs comparing infectious complications after TP and TR biopsies did not show significant differences in infection rates. The PREVENT trial compared TP without antibiotic prophylaxis with TR biopsy using rectal culture and targeted antibiotic prophylaxis, and showed that infection rates were 0% in TP and 1.4% in TR (p = 0.059) [438]. In the ProBE-PC trial, TP without routine antibiotic was compared with TR with antibiotic prophylaxis and composite infection rates were 2.7% and 2.6%, respectively [439].
An SR and meta-analysis of eight non-RCTs reported no significant differences between patients receiving or not receiving antibiotic prophylaxis before transperineal biopsy in terms of post-biopsy infection (0.11% vs. 0.31%) and sepsis (0.13% vs. 0.09%) [454]. This is in line with another systematic review and meta-analysis of 112 individual patient cohorts, which also showed no significant difference in the number of patients experiencing post-transperineal-biopsy infection, 1.35% of 29,880 patients receiving antibiotic prophylaxis, and 1.22% of 4,772 men not receiving antibiotic prophylaxis (p = 0.8) [455]. In addition, two RCTs have reported comparably low post-biopsy infection rates for transperineal biopsy regardless of whether antibiotic prophylaxis was administered or not [456,457]. An SR and meta-analysis, including 106 unique studies, comparing transperineal biopsy with and without prophylactic antibiotics found no significant differences in UTI or sepsis rates [455]. In addition, another SR and meta-analysis of 23 studies (only two RCTs) including 12,324 patients reported no significant differences between patients receiving or not receiving antibiotic prophylaxis in terms of post-biopsy sepsis (0.16% vs. 0.13%) and hospitalisation due to infectious complications (0.35% vs. 0.29%) for the transperineal approach [458]. Thus, there is a substantial body of evidence to suggest that, for patients without significant risk factors, such as diabetes or history of urinary retention [459], antibiotic prophylaxis may be safely omitted for transperineal biopsy.
An updated meta-analysis of eleven RCTs including 2,237 men showed that the use of a rectal povidone-iodine preparation before transrectal biopsy, in addition to antimicrobial prophylaxis, resulted in a significantly lower rate of infectious complications (RR: 0.47 95% CI: [0.36–0.61]) [436,451,460]. Single RCTs showed an advantage for rectal povidone-iodine preparation before transrectal biopsy compared to after biopsy [461]. A meta-analysis of four RCTs including 671 men evaluated the use of rectal preparation by enema before transrectal biopsy. No significant advantage was found regarding infectious complications (RR: 95% CI: 0.96 [0.64–1.54]) [436].
A meta-analysis of eleven studies with 1,753 patients showed significantly reduced infections after transrectal prostate biopsy when using antimicrobial prophylaxis as compared to placebo/control (RR: 95% CI: 0.56 [0.40–0.77]) [462].
For transrectal biopsies fluoroquinolones have been traditionally used for antibiotic prophylaxis. Recent years, however, have seen an increase in fluoroquinolone resistance. In addition, the European Commission has implemented stringent regulatory conditions regarding the use of fluoroquinolones, resulting in the suspension of the indication for perioperative antibiotic prophylaxis including prostate biopsy [463].
An SR and meta-analysis on antibiotic prophylaxis for the prevention of infectious complications following prostate biopsy concluded that, in countries in which fluoroquinolones are permitted as antibiotic prophylaxis, a minimum of a full one-day administration, as well as targeted therapy in case of fluoroquinolone resistance, or augmented prophylaxis (combination of two or more different classes of antibiotics) is recommended [462]. In countries in which the use of fluoroquinolones are suspended, cephalosporins or aminoglycosides can be used as individual agents with comparable infectious complications based on meta-analysis of two RCTs [462]. A meta-analysis of three RCTs reported that fosfomycin trometamol was superior to fluoroquinolones (RR: 95% CI: 0.49 [0.27–0.87]) [462], but routine general use should be assessed critically due to the relevant infectious complications reported in nonrandomised studies [464]. Of note, the indication of fosfomycin trometamol for prostate biopsy has been withdrawn in Germany because the manufacturers did not submit the necessary pharmacokinetic data in support of this indication. Urologists are advised to check their local guidance in relation to the use of fosfomycin trometamol for prostate biopsy. Another possibility is the use of augmented prophylaxis without fluoroquinolones, although no standard combination has been established to date. Finally, targeted prophylaxis based on rectal swap/stool culture is plausible, but no RCTs are available on non-fluoroquinolones. See Figure 5.1 for prostate biopsy workflow to reduce infections complications.
Taking into account the feasibility of TP and TR biopsies under local anaesthesia, comparable csPCa detection rates and the growing importance of antibiotic stewardship, the transperineal biopsy route is preferred over transrectal route despite potential logistical challenges.
5.6.4. Summary of evidence and recommendations for performing prostate biopsy(in line with the EAU Urological Infections Guidelines Panel)
| Summary of evidence | LE |
| A meta-analysis of 13 studies including 4,516 patients showed significantly reduced infectious complications in patients undergoing transperineal biopsy as compared to transrectal biopsy. | 1a |
| One randomised controlled trial showed comparable low rates of infectious complication for transperitoneal biopsy without antibiotics and transrectal biopsy with targeted antibiotic prophylaxis. | 1a |
| One randomised controlled trial showed superior detection of csPCa by transperineal biopsy compared with transrectal biopsy. | 1a |
| A meta-analysis of 23 studies (including two RCTs) with 12,324 patients reported comparable rates of post-biopsy infections in patients undergoing transperineal biopsy irrespective if antibiotic prophylaxis was given or not. | 2 |
| A meta-analysis of 12 RCTs including 2,437 men showed that use of a rectal povidone-iodine preparation before transrectal biopsy, in addition to antimicrobial prophylaxis, resulted in a significantly lower rate of infectious complications. | 1a |
| A meta-analysis on eleven studies with 1,753 patients showed significantly reduced infections after transrectal biopsy when using antimicrobial prophylaxis as compared to placebo/control. | 1a |
| Recommendations | Strength rating* |
| Perform prostate biopsy using the transperineal approach due to the low risk of infectious complications and better antibiotic stewardship. | Strong |
| Omit perioperative antibiotic prophylaxis in transperineal biopsy in patients without risk factors for infectious complications. | Weak |
| Use routine surgical disinfection of the perineal skin for transperineal biopsy. | Strong |
| Use rectal cleansing with povidone-iodine prior to transrectal prostate biopsy. | Strong |
For antibiotic prophylaxis in transrectal biopsy**, and from an antimicrobial stewardship perspective, the following options are recommended***:
| Strong |
| Ensure that prostate core biopsies from different sites are submitted separately for processing and pathology reporting. | Strong |
* The above strength ratings are explained here due to the major clinical implications of these recommendations. Although data showing the lower risk of infection via the transperineal approach is low in certainty, its statistical and clinical significance warrants its strong rating. Strong ratings are also given for routine surgical disinfection of skin in transperineal biopsy and povidone-iodine rectal cleansing in transrectal biopsy because, although the quality of the data is low, the clinical benefit is high and practical application simple. A ‘Strong’ rating is given for avoiding fluoroquinolones in prostate biopsy due to its legal implications in Europe.
** The indication of fosfomycin trometamol for prostate biopsy has been withdrawn in Germany as the manufacturers did not submit the necessary pharmacokinetic data in support of this indication. Urologists are advised to check their local guidance in relation to the use of fosfomycin trometamol for prostate biopsy.
***While most studies have been performed using fluoroquinolones, the applicability of these findings to non-fluoroquinolone antibiotics remains unclear.
Figure 5.2: Prostate biopsy workflow to reduce infectious complications*
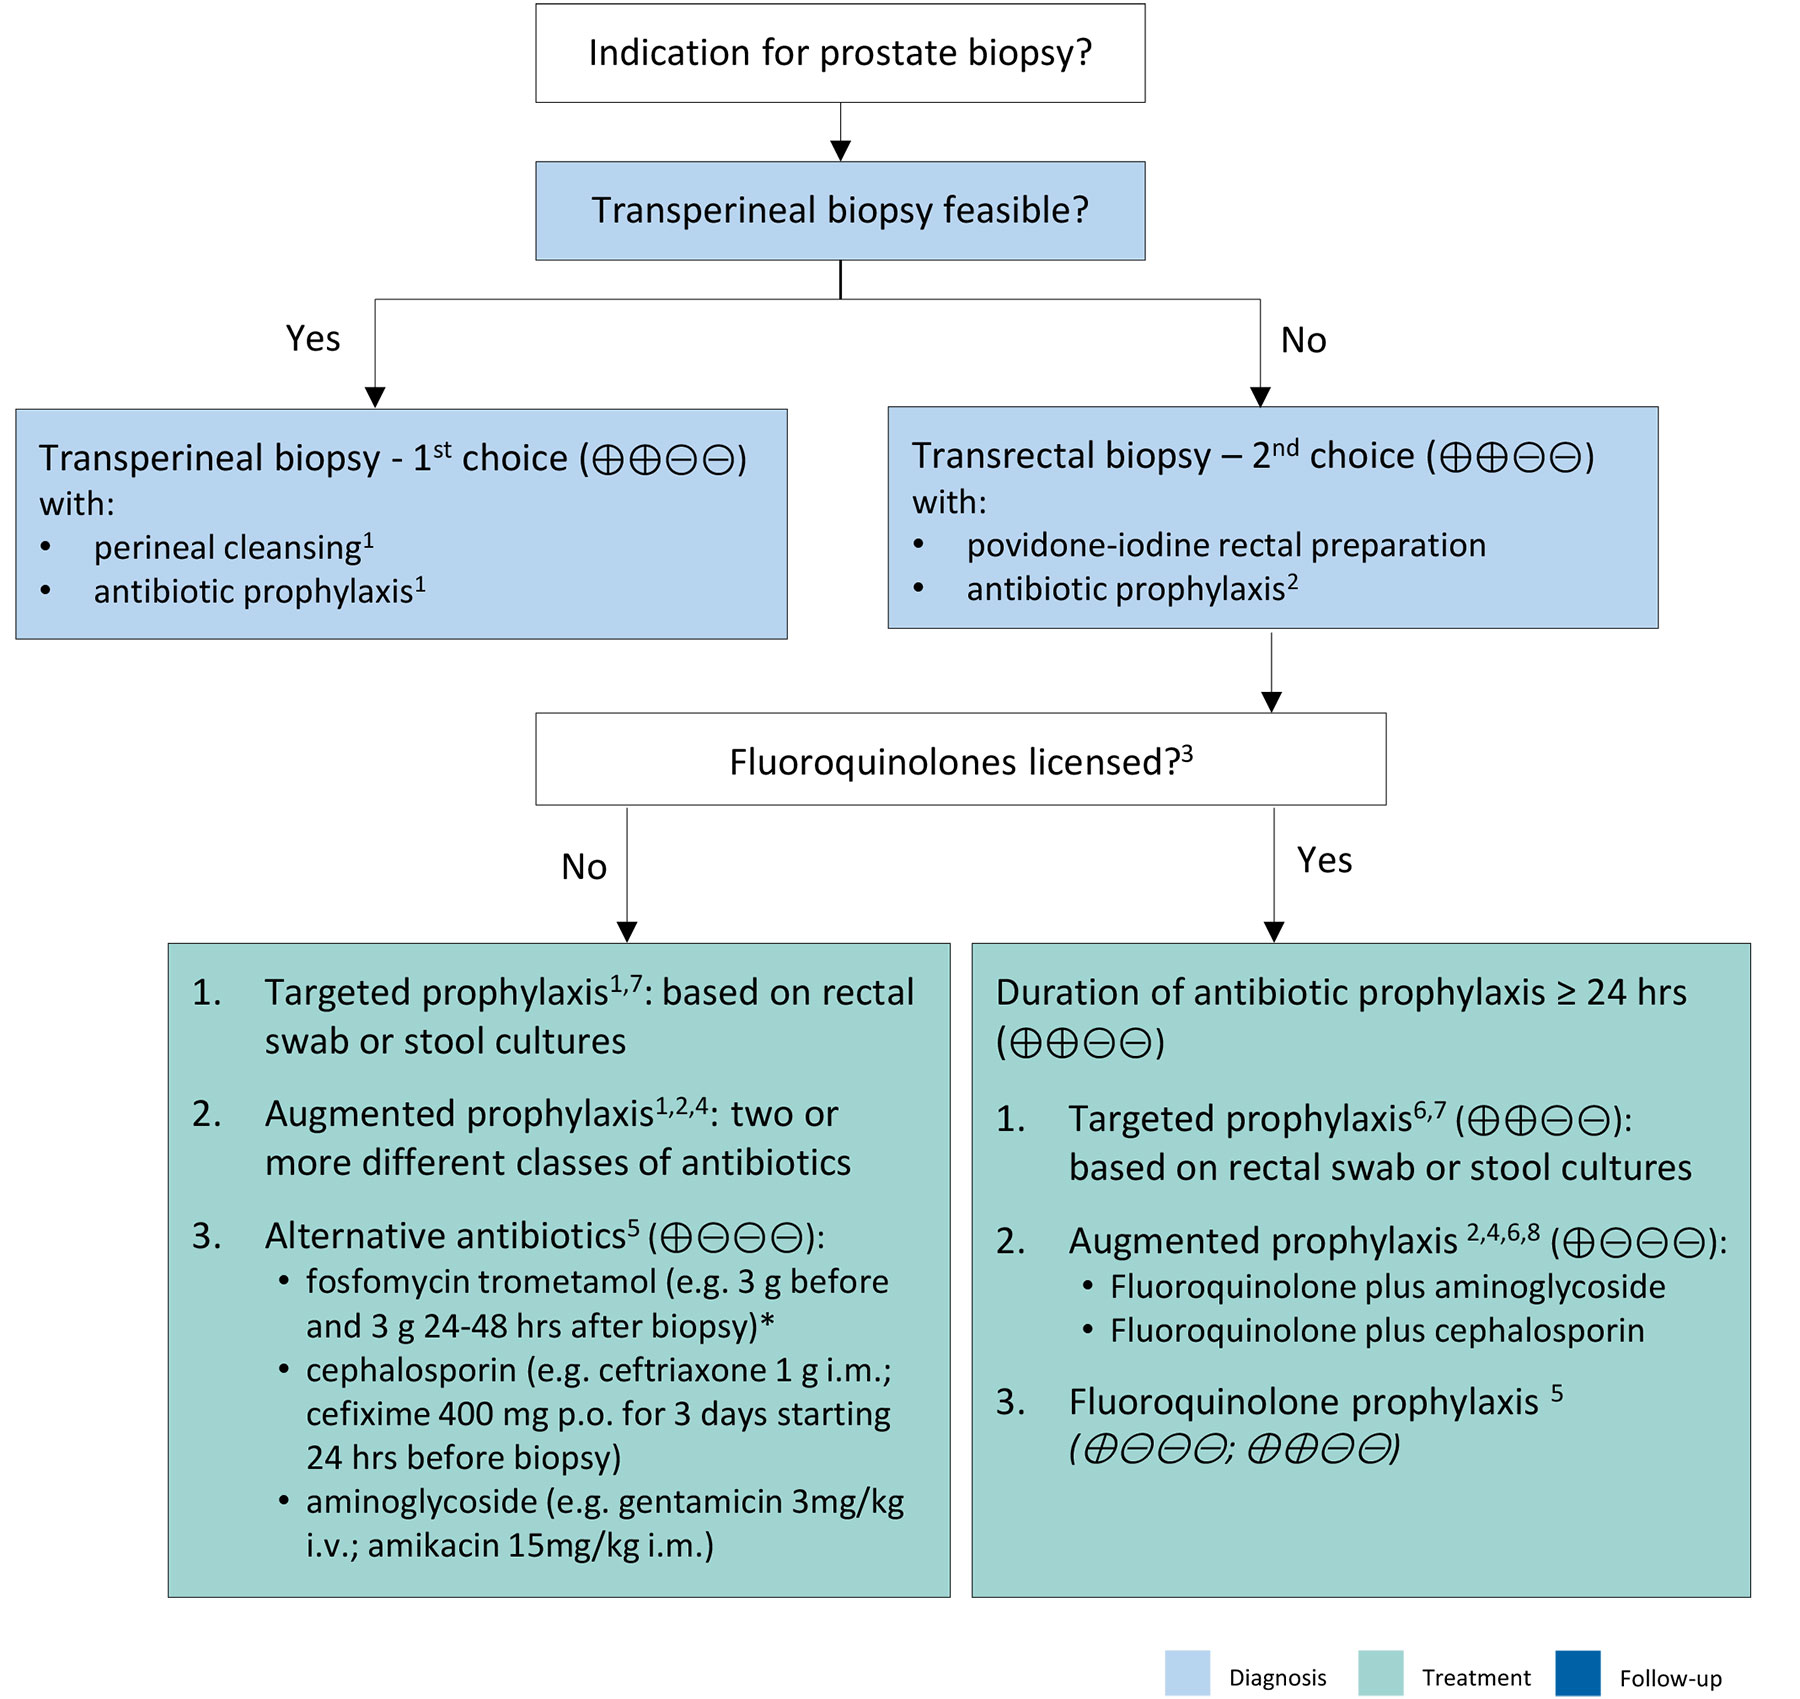 The following is the suggested workflow for reducing post-biopsy infections.
- Multiple systematic reviews including non-RCTs and two RCTs describe comparable rates of post-biopsy infection in patients with and without antibiotic prophylaxis.
- Be informed about local antimicrobial resistance.
- Banned by European Commission due to side effects.
- Contradicts principles of Antimicrobial Stewardship.
- Fosfomycin trometamol (4 RCTs), cephalosporins (2 RCTs), aminoglycosides (2 RCTs).
- Only one RCT comparing targeted and augmented prophylaxis.
- Originally introduced to use alternative antibiotics in case of fluoroquinolone resistance.
- Various schemes: fluoroquinolone plus aminoglycoside (4 RCTs); and fluoroquinolone plus cephalosporin(1 RCT).
Levels of evidence: High certainty (⊕⊕⊕⊕): very confident that the true effect lies close to that of the estimate of the effect; Moderate certainty (⊕⊕⊕⊖): moderately confident in the effect estimate. The true effect is likely to be close to the estimate of the effect, but there is a possibility that it will be substantially different; Low certainty (⊕⊕⊖⊖): confidence in the effect estimate is limited. The true effect may be substantially different from the estimate of the effect; Very low certainty: (⊕⊖⊖⊖) very little confidence in the effect estimate: the true effect is likely to be substantially different from the estimate of effect.
This figure has been adapted from Pilatz et al. with permission from Elsevier.
* The indication of fosfomycin trometamol for prostate biopsy has been withdrawn in Germany as the manufacturers did not submit the necessary pharmacokinetic data in support of this indication. Urologists are advised to check their local guidance in relation to the use of fosfomycin trometamol for prostate biopsy.
5.6.5. Complications
Complications of TRUS biopsy are listed in Table 5.9 [465]. Mortality after prostate biopsy is extremely rare and is usually a consequence of sepsis [466]. Low-dose aspirin is not an absolute contra-indication [467]. An SR found favourable infection rates for transperineal compared to TRUS biopsies with similar rates of haematuria, haematospermia and urinary retention [468]. A meta-analysis of 4,280 men randomised between transperineal versus TRUS biopsies in 13 studies found no significant differences in complication rates. However, data on sepsis compared only 497 men undergoing TRUS biopsy to 474 having transperineal biopsy. The transperineal approach required more local anaesthesia or other type of anaesthesia [469].
Table 5.9: Adverse events of three groups of targeted biopsy [465]*
| Overall (n = 234) | Transrectal MRI-TB (n = 77) | Transperineal FUS-TB (n = 79) | Transrectal COG-TB (n = 78) | p value | |
| Clavien-Dindo grade | - | - | - | - | < 0.001 |
| No adverse events | 30.3 (71) | 47.4 (36) | 29.1 (23) | 15.4 (12) | - |
| Grade 1 | 63.2 (148) | 50.0 (38) | 65.8 (52) | 74.4 (58) | - |
| Grade 2 | 6.0 (14) | 2.6 (2) | 5.1 (4) | 10.3 (8) | - |
| Grades 3, 4, 5 | - | - | - | - | - |
| Haematuria | 53.4 (125) | 35.5 (27) | 50.6 (40) | 74.4 (58) | < 0.001 |
| Haematospermia | 37.2 (87) | 26.3 (20) | 35.4 (28) | 50.0 (39) | < 0.01 |
| Rectal bleeding | 3.4 (8) | 2.6 (2) | 2.5 (2) | 5.1 (4) | 0.59 |
| UTI | 3.4 (8) | 2.6 (2) | 1.3 (1) | 6.4 (5) | 0.21 |
| Fever | 3 (7) | 1.3 (1) | 2.5 (2) | 5.1 (4) | 0.46 |
| Urinary retention | 3 (7) | - | 3.8 (3) | - | 0.15 |
| Haematoma | 1.3 (3) | - | 3.8 (3) | - | 0.29 |
| Other | - | - | - | - | 0.56 |
| Lower back pain | 0.9 (2) | 1.3 (1) | 1.3 (1) | - | - |
| Atrial fibrilation | 0.4 (1) | - | 1.3 (1) | - | - |
COG-TB = cognitive registration TRUS targeted biopsy; FUS-TB = MRI-TRUS fusion targeted biopsy; MRI = magnetic resonance imaging; MRI-TB = in-bore MRI targeted biopsy; TB = targeted biopsy; TRUS = transrectal ultrasound; UTI = urinary tract infection. Data are presented as % (n).
*With permission from Elsevier.
5.7. What diagnostic pathway in clinical practice?
The ‘combined pathway’, in which patients with a positive MRI undergo combined systematic and targeted biopsy, and patients with a negative MRI undergo systematic biopsy, maximises the detection of ISUP GG ≥ 2 cancers. However, it has the disadvantage of leading to a greater detection of ISUP GG 1 cancers and of referring all patients with a clinical suspicion of cancer to biopsy. Given the growing concerns about overdetection of insignificant PCa, the development of AS protocols in patients with ISUP GG 2 cancers (see Section 6.2.1.b) and the grade shift induced by MRI-targeted biopsy (see Section 5.5.6), the clinical relevance of a diagnostic strategy aimed only at maximising the detection of ISUP GG ≥ 2 cancers, disregarding its negative effects, is questionable [470,471].
The ‘MRI pathway’, in which patients with a positive MRI undergo only MRI-targeted biopsy and patients with a negative MRI are not biopsied at all, could avoid biopsy in 21-49% of the patients if a PI-RADS threshold of ≥ 3 is used to trigger biopsy [135,226,264,375], at the cost of missing a small number of mainly ISUP GG 2 cancers, especially in biopsy-naïve patients or in highly selected populations with high prevalence of csPCa (in which the MRI NPV decreases) [372,472].
Adding perilesional sampling to targeted biopsy could mitigate the drawbacks of the ‘MRI pathway’ by maintaining good detection of csPCa while decreasing the overdiagnosis of insignificant cancer (see Section 5.5.4). Due to the low NPV of MRI in high-risk populations, systematic biopsies are still necessary in patients with negative MRI and high clinical suspicion of PCa, e.g. high PSA density.
MRI-directed pathways were compared to the classical combined pathway in a retrospective cohort of 499 men. The highest clinical utility above a risk threshold of 6.25% was obtained by means of a risk-based pathway in which patients with a PI-RADS score of 1-3 and a low-risk profile (PSA-D < 0.15ng/ml/cc, negative DRE, no family history, no ASAP or ISUP1 cancer at prior biopsy) could forgo biopsy while the others underwent combined systematic and MRI-targeted biopsy. In this pathway, biopsy could have been avoided in 99 men (19%) while missing ISUP GG ≥ 2 cancers in only six men (1.2%) [473].
5.7.1. Repeat biopsy after negative biopsy
During follow-up after a negative systematic biopsy, the incidence of PCa is higher, but the risk of PCa death is lower than the population average [474]. Men with prior negative systematic biopsy and persistent suspicion of PCa should have an MRI if one has not already been performed.
Significant PCa may still be present in men with abnormal MRI and negative targeted biopsy [475]. Therefore, follow-up or direct repeat biopsy should be considered dependant of risk factors (e.g. PSA density, PI-RADS score).
In a contemporary series of biopsies, the likelihood of finding a csPCa after follow-up biopsy after a diagnosis of atypical small acinar proliferation and high-grade prostatic intraepithelial neoplasia (PIN) was only 6-8% - not significantly different from follow-up biopsies after a negative biopsy [476,477]. Therefore, routine re-biopsies in this setting are not required.
The added value of other biomarkers remains unclear (see Section 5.2.7).
5.7.2. Saturation biopsy
The incidence of PCa detected by saturation repeat biopsy (> 20 cores) is 30–43% and depends on the number of cores sampled during earlier biopsies [478]. Saturation biopsy may be performed using the transperineal technique, which detects an additional 38% of PCa. The rate of urinary retention varies substantially from 1.2% to 10% [323,479].
However, given the very low risk of subsequent csPCa after a negative biopsy in the current MRI-driven diagnostic pathway, such schemes should not be routinely used [480].
5.7.3. Seminal vesicle biopsy
Indications for SV (staging) biopsies are poorly defined. At a PSA of > 15ng/mL, the odds of tumour involvement are 20–25% [481]. A SV staging biopsy is only useful if it has a decisive impact on treatment, such as ruling out radical tumour resection or for potential subsequent RT. Its added value compared with MRI is questionable.
5.7.4. Transition zone biopsy
Transition zone sampling during baseline biopsies has a low detection rate and should be limited to MRI detected lesions or repeat template biopsies [482].
5.8. Diagnosis - Clinical Staging
5.8.1. T-staging
The cT category listed in Table 4.1 relies only on DRE findings. Imaging parameters and biopsy results for local staging are, so far, not part of the T staging (within TNM) and the EAU risk category stratification [483].
5.8.1.a. Ultrasound-based techniques and computed tomography
Transrectal US has limited accuracy for PCa local staging [484]. More advanced US-based techniques have not yet been tested in large-scale studies. In case of locally advanced cancers, abdominopelvic US or CT may show rectal or bladder invasion and dilatation of the upper collecting systems [484].
5.8.1.b. Magnetic resonance imaging
T2-weighted imaging remains the most useful method for local staging on MRI. Pooled data from a meta-analysis showed a sensitivity and specificity of 0.57 (95% CI: 0.49–0.64) and 0.91 (95% CI: 0.88–0.93); 0.58 (95% CI: 0.47–0.68) and 0.96 (95% CI: 0.95–0.97); and 0.61 (95% CI: 0.54–0.67) and 0.88 (95% CI: 0.85–0.91), for EPE, SVI, and overall stage T3 assessment, respectively [485]. Similar results, with low sensitivity and good specificity have also been found in more recent large series [486-488].
Traditionally, EPE/SVI is assessed visually using qualitative signs (e.g. capsular disruption, visible tumour within periprostatic fat). Inter-reader agreement with such subjective reading is moderate, with kappa values ranging from 0.41 to 0.68 [489]. The length of tumour capsule contact (LCC) is also a significant predictor of EPE. It has the advantage of being quantitative, although the ideal cut-off value remains debated [490,491]. Several grading systems combining subjective qualitative signs and/or LCC into a score have shown good sensitivity (0.64-0.82) and specificity (0.64-0.93) for EPE, with substantial inter-reader agreement (κ = 0.56-0.74). None of these scores has shown definitive superiority over the others [492,493].
Magnetic resonance imaging findings can improve the prediction of the pathological stage when combined with clinical and biopsy data. As a result, several groups developed multivariate risk calculators for predicting EPE/SVI or positive surgical margins [494]. These tools are particularly helpful when MRI does not show EPE/SVI due to its low sensitivity in the presence of microscopic EPE in patients with other aggressive disease features. In external validation cohorts, these risk calculators showed significantly better discrimination than nomograms without MRI-based features [495,496].
Simple MRI features such as the tumour PI-RADS score, diameter or ADC value, or ECE/SVI features are strong predictors of BCR, alone or in combination with clinical data [497]. In 552 men treated by RP at seven different Dutch centres, MRI showed significantly higher sensitivity (51% vs. 12%; p < 0.001), and lower specificity (82% vs. 97%; p < 0.001) than DRE for non-organ-confined disease. All risk groups redefined using MRI findings rather than DRE findings showed better BCR-free survival due to improved discrimination and the Will Rogers phenomenon [498]. In one study of 604 patients who underwent RP at a single centre, the Cancer of the Prostate Risk Assessment Postsurgical (CAPRA-S) model obtained similar results in predicting BCR after RP when the pathological EPE or SVI data were replaced by MRI-based EPE or SVI assessment. Additionally, among the patients with pathological T3 disease, RFS was better for those without T3 disease on MRI than for those with T3 disease [487].
Given its low sensitivity for focal (microscopic) EPE, MRI is not recommended for local staging in low-risk patients. However, MRI can still be useful for treatment planning.
5.8.2. N staging
5.8.2.a. Computed tomography and MRI
Abdominal CT and T1-T2-weighted MRI indirectly assess nodal invasion by using LN diameter and morphology. However, the size of nonmetastatic LNs varies widely and may overlap the size of LN metastases. Usually, LNs with a short axis > 8mm in the pelvis and > 10mm outside the pelvis are considered malignant. Decreasing these thresholds improves sensitivity but decreases specificity. As a result, the ideal size threshold remains unclear [499,500]. Computed tomography and MRI sensitivity is less than 40% [501]. Detection of microscopic LN invasion by CT is < 1% in patients with ISUP grade group < 4 cancer, PSA < 20ng/mL or localised disease [499,502].
5.8.2.b. Risk calculators incorporating MRI findings and clinical data
Computed tomography and MRI lack sensitivity for direct detection of positive LNs. Different risk calculators and nomograms which combine clinical data, systematic and/or MRI-targeted biopsy results and, for some of them, MRI findings have been developed and externally validated to estimate the risk of patients harbouring positive LNs [503-507]. The use of these models requires the adoption of arbitrary cut-offs, which reflect a balance between the risk of missing positive nodes and the additional operative time and potential complications of PLND. The application of commonly proposed thresholds is associated with limited specificity, leading to a considerable proportion of patients undergoing potentially unnecessary PLND, particularly in settings with low prevalence of LNI.
5.8.2.c. Prostate-specific membrane antigen-based PET/CT
PSMA is an attractive target because of its specificity for prostate tissue, even if the expression in other non-prostatic malignancies or benign conditions may cause incidental false-positive findings [508,509].
A multicentre prospective phase III imaging trial investigating men with intermediate- and high-risk PCa who underwent RP and PLND showed a sensitivity and specificity of 68Ga-PSMA-11 PET of 0.40 (95% CI: 0.34-0.46), and 0.95 (95% CI: 0.92-0.97), respectively [510]. This is in line with previous results from prospective, multicentre studies addressing the accuracy of 68Ga-PSMA and 18F-DCFPyL PET/CT for LN staging in patients with newly diagnosed PCa [511-513]. Prostate-specific antigen may be a predictor of a positive PSMA PET/CT. In the primary staging cohort from a meta-analysis; however, no robust estimates of positivity were found [514].
A comparison between PSMA PET/CT and MRI was performed in a SR and meta-analysis including 13 studies (n = 1,597) [515]. 68Ga-PSMA was found to have a higher sensitivity and a comparable specificity for staging preoperative LN metastases in intermediate- and high-risk PCa [516].
PSMA PET/CT has a good sensitivity and specificity for LN involvement, possibly impacting clinical decision-making. In an SR and meta-analysis including 37 studies, a subgroup analysis was performed in patients undergoing PSMA PET/CT for primary staging. On a per-patient-based analysis, the sensitivity and specificity of 68Ga-PSMA PET were 77% and 97%, respectively, after eLND at the time of RP. On a per-lesion based analysis, sensitivity and specificity were 75% and 99%, respectively [514].
In summary, PSMA PET/CT is more sensitive in N staging as compared to MRI or abdominal contrast-enhanced CT. However, small LN metastases, under the spatial resolution of PET, may still be missed.
5.8.2.d. Risk calculators incorporating MRI and PSMA findings
An international, multicentre study incorporated PSMA PET into existing nomograms to predict pelvic LN metastatic disease in PCa patients. Performance of three nomograms was assessed in 757 patients undergoing RARP and ePLND. The addition of PSMA PET to the nomograms substantially improved the discriminative ability of the models, yielding cross-validated AUCs of 0.76 (95% CI: 0.70–0.82), 0.77 (95% CI: 0.72–0.83) and 0.82 (95% CI: 0.76–0.87), respectively [517]. The same group developed a nomogram incorporating staging MRI and PSMA PET findings to predict LN metastases in a contemporary cohort of 700 patients from the Netherlands, who underwent RP and ePLND. The nomogram was then tested in 305 patients who underwent RP and ePLND at two centres in Australia. On this external cohort, the nomogram performed significantly better than the Briganti 2017 and the MSKCC nomograms. Its performance was similar to that of the Briganti 2019 nomogram [518]. However, given the excellent specificity of PSMA PET, it remains unclear whether a nomogram is required in patients with PSMA PET-positive lesions.
New models have been developed and externally validated in patients with negative PSMA PET, with the aim of identifying those at risk of harbouring micrometastatic disease undetectable by this modality due to its spatial resolution (≈5 mm) [507,519].
5.8.2.e. Surgical techniques
5.8.2.e.1. Pelvic lymph node dissection
Extended PLND includes removal of the nodes overlying the external iliac artery and vein, the nodes within the obturator fossa located cranially and caudally to the obturator nerve, and the nodes medial and lateral to the internal iliac artery. Metastatic LN deposits, usually small volume, missed by modern imaging can be detected with ePLND [510]. Extended PLND is able to obtain higher LN yield and LN positivity compared to limited PLND [520]. As such, ePLND is a staging procedure that provides accurate information to guide management and prognostication [521].
There has been significant interest in whether this would also improve clinical outcomes. However, a meta-analysis demonstrated that performing PLND during RP failed to improve oncological outcomes, including survival [522]. Moreover, two RCTs show no benefit of ePLND versus limited PLND in terms of freedom from biochemical recurrence [523,524]. After additional follow-up, a secondary report from the largest RCT did demonstrate a lower rate of distant metastasis, even though the median number of lymph nodes removed was similar in the two arms (12 vs. 14) and the proportions of patients with an involved lymph node were also comparable (11% vs. 13%) between the arms [523]. In addition, these updated results confirmed the lack of effect of ePLND on the development of biochemical recurrence or local pelvic nodal recurrence.
Furthermore, drivers of oncological differences were largely in the pN1 group, where a rapid event rate was observed, where PSMA PET is most likely to detect metastases either preoperatively or postoperatively if associated with a persistent PSA [525].
5.8.2.e.2. Complications of extended pelvic lymph node dissection
Extended PLND increases morbidity in the treatment of PCa [521]. In a SR and meta-analysis of postoperative complications after RP, 31.5% of reported complications were due to lymphocele, with 10% requiring surgical/percutaneous drainage [526]. Contemporary ePLND-related RCTs indicate ongoing variation in symptomatic lymphocele rates (0.9% - 9.7%) [527,528], with a large RCT of peritoneal flap after ePLND reporting an 8% rate of lymphocele requiring drainage [529]. The extent of PLND also increases the risk of lymphocele formation (RR: 1.77, 95% CI: 1.45-2.16, p < 0.0001) [526]. When performed in the same patient but randomised to ePLND or limited PLND on each side, side-specific ePLND complications (compared to limited PLND) were 8.1% versus 2.4% (p = 0.08) [530]. Thromboembolic events are also more common with a meta-analysis suggesting that PLND increases the risk of thromboembolic disease by a factor of 2.8 in comparison to no PLND [531]. Lastly, an SR and meta-analysis, among all complications (14.1% overall), those “likely” to be related to PLND included DVT (2.8%), PE (2.1%), pelvic haematoma (2.6%) and lymphoedema (1.5%) [526].
Data on patient reported outcomes following ePLND are lacking. Available data suggests that these harms impact QoL, with the LAPPRO trial reporting significantly higher rates of lymphoedema following PLND versus no PLND (4.5% vs. 1.4%, RR: 2.7 95% CI: 1.2-6.3 p = 0.014), numerically worse in the ePLND group versus limited PLND (6.8% vs. 2.1%, RR: 3.4 95% CI: 0.6-19.0 p = 0.16), which translated to a worse overall QoL (adjusted for incontinence and erectile dysfunction) as reported by patients at three months (10.7% moderate/much bother, RR: 1.5 95% CI: 1.2-2.0 p < 0.001) and clinicians at 12 months (worse QoL 13.5%, RR: 5.7 95% CI: 1.9-16.4
p = 0.002) but not at 24 months (worse QoL 5.7%, RR: 0.8 95% CI: 0.1-6.1 p = 0.83) [532]. Lymphoedema is also more likely after ePLND followed by postoperative pelvic RT, than either treatment in isolation [533].
Despite some staging advantages, it is difficult to define which patients may benefit from ePLND owing to the lack of proof of an oncological benefit, with a significant risk of morbidity. The incorporation of PSMA PET/CT into clinical practice reduces the gap between imaging and pathological staging to fundamentally alter the risk/benefit ratio. Novel nomograms that incorporate imaging (MRI, PSMA PET/CT) can be used, particularly with a negative PSMA PET/CT but high risk of metastasis. It is unclear whether ePLND first with a subsequent adjuvant/salvage approach, or no ePLND with PSA- or imaging-guided postoperative treatment is superior in terms of oncological outcomes. Before offering ePLND, clinicians should discuss the uncertainties regarding the benefits and possible advantage of detecting low-volume nodal disease via ePLND and how this may impact postoperative management against the risks and harms associated with ePLND.
5.8.2.e.3. Strategies to reduce complications of extended pelvic lymph node dissection
Lymphocele complications might be reduced by incorporation of a peritoneal interposition flap, with a SR of RCTs reporting reduced symptomatic lymphocele (OR: 0.46, 95% CI: 0.23–0.93), overall lymphocele (OR: 0.51, 95% CI: 0.38–0.68) and Clavien-Dindo ≥ 3 complications (OR: 0.41, 95% CI: 0.22–0.85) without major function impairment [471]. The PELYCAN trial (n = 551) supported the benefits of bilateral peritoneal interposition flaps compared to no flap in reducing symptomatic lymphocele (3.7% vs. 9.1%, p = 0.005) and asymptomatic lymphocele (10.3% vs. 27.2%, p < 0.001) without compromise in postoperative complications at the expense of longer operating time (11 minutes, p < 0.001) [472]. However, a large trial of 1,080 patients reported no difference in symptomatic (requiring intervention; 7.2% vs 8.8%, p = 0.4) and radiological (29.5% vs 34.5%, p = 0.4) lymphocele rates when a peritoneal flap was used compared to none, nor any differences in complications or functional outcomes [529].
5.8.2.e.4. Lymph-node-positive patients during radical prostatectomy
Although no RCTs are available, data from prospective cohort studies comparing survival of pN+ patients (as defined following pathological examination after RP) support that RP may have a survival benefit over abandonment of RP in node-positive cases [534]. Consequently, there is no role for performing frozen section of suspicious LNs.
5.8.2.e.5. Sentinel node biopsy analysis
The rationale for a sentinel node biopsy (SNB) is based on the concept that a sentinel node is the first to be involved by migrating tumour cells. Therefore, if this node is negative, an ePLND can be avoided [535]. Intraprostatic injections of indocyanine green (ICG) have been used to visualise prostate-related LNs for SNB. A randomised comparison found more cancer-containing LNs in men who underwent a PLND guided by ICG but no difference in BCR at 22.9-month follow-up [536]. An SR of 21 studies showed a sensitivity of 95.2% and NPV of 98.0% for SNB in detecting men with metastases at ePLND [537]. An SR and meta-analysis of 13 studies reported high per-patient sensitivity (0.87) and NPV (0.95) rates, but at a “per node” level the sensitivity (0.53) dropped but NPV (0.96) and detection rate (0.92) was maintained [538]. However, this review was hampered by widespread heterogeneity of both definitions and how SNB is performed. This prompted the development of an expert consensus report to guide further research [535]. A randomised trial reported on ICG-only PLND (ICG-stained lymph nodes only, following preoperative injection of ICG into bilateral transition zones) compared to ePLND in 108 patients undergoing RP following staging with conventional imaging [539]. Operative time, lymph node counts (median 24 vs. 7) and postoperative lymphoedema (RR: 4.75, p < 0.05) were higher in the ePLND group but pN1 (ePLND 22% vs. ICG-PLND 28%, p = 0.7) and 24-month BCR-free survival (ePLND 83% vs. ICG-PLND 75%, p = 0.58) rates were similar between the groups.
The prospective SENTINELLE study investigated the diagnostic accuracy of sentinel lymph node biopsy-guided lymph node dissection (following intraprostatic injection of [99m]Tc-nanocolloid) compared to extended pelvic LN dissection in patients with intermediate- or high-risk prostate cancer. Sensitivity, specificity, NPV and positive predictive value of the SNB method in detecting patients with at least one LN metastasis were 95.4% (95% CI: 75.1-99.7), 100% (95% CI: 96.6-100), 99.2% (95% CI: 95.5-99.9) and 100% (95% CI: 80.7-100), respectively [545].
An emerging alternative to sentinel node removal following intraprostatic injections is PSMA-guided lymph node dissection following intravenous radioisotope injection and intraoperative radio guidance or optical guidance [540]. Initial studies report high specificity approaching 100%, although limited sensitivity and associated poor negative predictive value restrict the functional value at this point.
5.8.3. M staging
5.8.3.a. Bone scan
99mTc-bone scan is a highly sensitive conventional imaging technique, evaluating the distribution of active bone formation in the skeleton related to malignant and benign disease. A meta-analysis showed combined sensitivity and specificity of 79% (95% CI: 73–83%) and 82% (95% CI: 78–85%) at patient level [541]. Bone scan diagnostic yield is significantly influenced by the PSA level, the clinical stage and the tumour ISUP grade group [499,542]. A retrospective study investigated the association between age, PSA and GS in 703 newly diagnosed PCa patients who were referred for bone scintigraphy. The incidence of bone metastases increased substantially with rising PSA and upgrading GS [543]. In two studies, a dominant Gleason pattern of four was found to be a significant predictor of positive bone scan [544,545]. Bone scanning should be performed in symptomatic patients, independent of PSA level, ISUP GG or clinical stage [499]. Nevertheless, bone scintigraphy reveals low specificity (64.5%) and positive predictive value (55.4%), with a relatively low interobserver agreement [546]. Additional single-photon emission computed tomography (SPECT) using 99mTc-diphosphonates may overcome these limitations, by improved discrimination of benign and equivocal findings. In a multicentre phase III trial in patients with high-risk prostate or breast cancer, SPECT exhibited a sensitivity, specificity, and PPV of 63.3%, 87.5% and 78.4%, respectively [547].
5.8.3.b. Fluoride PET/CT and MRI
18F-sodium fluoride (18F-NaF) PET or PET/CT, similarly to bone scintigraphy, only assesses the presence of bone metastases. The tracer was reported to have similar specificity and superior sensitivity to bone scintigraphy for detecting bone metastases in patients with newly diagnosed high-risk PCa [548,549]. Interobserver agreement for the detection of bone metastases was excellent, demonstrating that 18F-NaF PET/CT is a robust tool for the detection of osteoblastic lesions in patients with PCa [550].
Diffusion-weighted whole-body and axial skeleton MRI are more sensitive than bone scintigraphy and targeted conventional radiography in detecting bone metastases in high-risk PCa. Whole-body MRI can also detect visceral and nodal metastases, having been shown to be more sensitive and specific than combined bone scintigraphy, targeted radiography and abdominopelvic CT [551].
5.8.3.c. PSMA PET/CT
A SR including 12 studies (n = 322) reported high variation in 68Ga-PSMA PET/CT sensitivity for initial staging (range 33–99%; median sensitivity on per-lesion analysis 33–92%, and on per-patient analysis 66–91%), with good specificity (per-lesion 82–100%, and per-patient 67–99%), with most studies demonstrating increased detection rates with respect to conventional imaging modalities (bone scan and CT) [552].
In a prospective multicentre study in patients with high-risk PCa before curative surgery or RT (ProPSMA), 302 patients were randomly assigned to conventional imaging or 68Ga-PSMA-11 PET/CT [553]. The primary outcome focused on the accuracy of first-line imaging for the identification of pelvic LN or distant metastases. Accuracy of 68Ga-PSMA PET/CT was 27% (95% CI: 23–31) higher than that of CT and bone scintigraphy (92% [95% CI: 88–95] vs. 65% [95% CI: 60–69]; p < 0.0001). Conventional imaging had a lower sensitivity (38% [95% CI: 24–52] vs. 85% [95% CI: 74–96]) and specificity (91% [95% CI: 85–97] vs. 98% [95% CI: 95–100]) than PSMA PET/CT. Furthermore, 68Ga-PSMA PET/CT scan prompted management change more frequently as compared to conventional imaging (41 [28%] men [95% CI: 21–36] vs. 23 [15%] men [95% CI: 10–22], p = 0.08), with less equivocal findings (7% [95% CI: 4–13] vs. 23% [95% CI: 17–31]) and lower radiation exposure (8.4 mSv vs. 19.2 mSv; p < 0.001) [553].The comparison of whole-body MRI and PSMA PET/CT in detecting bone metastases has led to inconclusive opposite results in two small cohorts [516,554].
The added prognostic value of presurgical PSMA-PET for BCR-Free Survival (FS), compared with the presurgical Cancer of the Prostate Risk Assessment (CAPRA) and postsurgical CAPRA-Surgery (CAPRA-S) scores, in patients with intermediate- to high-risk PCa treated with RP and PLND has been investigated [555]. During a 32-month (interquartile range 23.3–42.9) follow-up, 91/240 (38%) BCR events were observed. The addition of PSMA-PET N1/M1 status to the presurgical CAPRA score improved the risk assessment for BCR significantly in comparison with the presurgical CAPRA score alone (C-statistic 0.70 [0.64–0.75] vs 0.63 [0.57–0.69]; p < 0.001).
5.8.4. Summary of evidence and practical considerations on initial N/M staging
The field of non-invasive N- and M-staging of PCa patients is evolving very rapidly. Evidence shows that PSMA PET/CT and whole-body MRI provide a more sensitive detection of LN and bone metastases than the classical work-up with bone scan and abdominopelvic CT. Initial results of a follow-up study of the surgical cohort in the multicentre prospective phase III imaging trial demonstrate that presurgical PSMA-PET is a strong prognostic biomarker, improving BCR-FS risk assessment [555]. However, the ideal management of patients diagnosed as metastatic by these more sensitive tests is yet unknown [556].
5.8.5. Recommendations for staging of prostate cancer
| Recommendations | Strength rating |
| Any risk group staging | |
| Use prebiopsy magnetic resonance imaging (MRI) for local staging information. | Weak |
| Low-risk and favourable intermediate-risk localised disease | |
| Do not use additional imaging for staging purposes. | Strong |
| Unfavourable intermediate-risk disease | |
| Perform prostate-specific antigen positron emission tomography/computed tomography (PSMA PET/CT), if available, to increase accuracy, or at least cross-sectional abdominopelvic imaging and a bone scan. | Weak |
| High-risk localised disease/locally advanced disease | |
| Perform metastatic screening using PSMA PET/CT, if available, or at least cross-sectional abdominopelvic imaging and a bone-scan. | Strong |