
6. PROGNOSTIC FACTORS
6.1. Definition and classification
Prognostic factors are defined as variables associated with clinical endpoints (i.e. recurrence, progression and survival) independent of a treatment, thereby reflecting the natural course of the disease. Predictive factors, in contrast, provide information on the effectiveness (i.e. response, progression, survival) of a specific treatment. Notably, there is substantial overlap between the two categories, because prognostic factors may also serve as predictive factors and vice versa. Both can be classified into anatomical, histological, clinical and molecular factors.
6.2. Anatomical factors
Tumour size, venous invasion and extension, collecting system invasion, perinephric- and sinus fat invasion, adrenal involvement and LN and distant metastasis are included in the TNM classification system [90,102] (see Table 4.1).
6.3. Histological factors
Histological factors include tumour grade, RCC subtype, lymphovascular invasion, tumour necrosis and invasion of the collecting system [207,208]. Tumour grade is considered one of the most important histological prognostic factors. The Fuhrman nuclear grade [209] has now been replaced by the WHO/ISUP grading classification [210]. This relies solely on nucleolar prominence for grade 1-3 tumours, allowing for less interobserver variation [211]. It has been shown that the WHO/ISUP grading provides superior prognostic information compared to Fuhrman grading, particularly for grade 2 and grade 3 tumours [212]. Rhabdoid and sarcomatoid changes can be found in all RCC types and are equivalent to grade 4 tumours. Sarcomatoid changes are more often found in chRCC than other subtypes [213]. The percentage of the sarcomatoid component appears to be prognostic as well, with a larger percentage of involvement being associated with worse survival. There is no agreement on the optimal prognostic cut-off for subclassifying sarcomatoid changes [214,215], although 20% has been suggested to distinguish focal and extensive amount of sarcomatoid features [216]. The WHO/ISUP grading system is applicable to both ccRCC and pRCC. Grading chRCC is currently not recommended. However, a study suggested a two-tiered chRCC grading system (low vs. high grade) based on the presence of sarcomatoid differentiation and/or tumour necrosis, which was statistically significant on multivariable analysis [217]. Both the WHO/ISUP and chRCC grading systems must be validated for prognostic systems and nomograms [210].
Renal cell carcinoma subtype is regarded as another important prognostic factor. On univariable analysis, patients with chRCC vs. pRCC vs. ccRCC had a better prognosis [218,219] (Table 6.1). However, prognostic information provided by the RCC type is lost when stratified according to tumour stage [219,220] (LE: 3).
Table 6.1: Cancer-specific survival by stage [218]
| Grade | HR (95% CI) |
| T1N0M0 | Referent |
| T2N0M0 | 2.71 (2.17-3.39) |
| T3N0M0 | 5.20 (4.36-6.21) |
| T4N0M0 | 16.88 (12.40-22.98) |
| N+M0 | 16.33 (12.89-20.73) |
| M+ | 33.23 (28.18-39.18) |
CI = confidence interval; HR = hazard ratio.
6.4. Clinical factors
Clinical factors include performance status (PS), local symptoms, early versus late recurrence, cachexia, anaemia, platelet count, neutrophil count, lymphocyte count, CRP [229], albumin and various indices deriving from these factors, such as the neutrophil-to-lymphocyte ratio (NLR) [118,230-236] (LE: 3). As a marker of systemic inflammatory response, a high preoperative NLR has been associated with poor prognosis [237], but there is significant heterogeneity in the data and no agreement on the optimal prognostic cut-off. Even though obesity is an aetiological factor for RCC, it has also been observed to provide prognostic information. A high body mass index (BMI) appears to be associated with improved survival outcomes in both non-metastatic and metastatic RCC [238-240]. This association is linear with regards to cancer-specific mortality (CSM), while RCC patients with obesity show increasing all-cause mortality with increasing BMI [241]. Evidence is also available on the prognostic value of body composition indices measured on cross-sectional imaging, such as sarcopenia and fat accumulation [235,242,243]. Health-related quality of life (HRQoL) at baseline and during treatment of mRCC may also be prognostic. In CheckMate 214, HRQoL measured by the Functional Assessment of Cancer Therapy Kidney Symptom Index 19 at baseline and during follow-up was associated with improved OS in both the ipilimumab+nivolumab and the sunitinib arm [244]. Perioperative blood transfusion is linked to worse cancer-specific and overall mortality, as well as a higher risk of recurrence. However, receiving one to two units of packed red blood cells does not significantly impact outcomes compared to receiving three or more units. Notably, intraoperative transfusion is associated with higher cancer-specific mortality and recurrence, while postoperative transfusion is not [245].
6.4.1. Frailty and comprehensive geriatric assessment
Frailty is a geriatric syndrome characterised by a decline in individuals’ resilience and physiological functional reserve across multiple body systems, resulting in increased vulnerability to external stressors [246,247]. Frailty is an adverse prognostic factor in older patients with localized RCC, being associated with worse perioperative outcomes as well as poorer oncological outcomes across different stages [246].
Several instruments have been developed and implemented in clinical practice for the diagnosis and measurement of frailty [247].
Among these, the G8 (Geriatric 8) health status screening tool, which assesses several patient variables (age, perceived health status, food intake, weight loss, BMI, mobility, neuropsychology, and polypharmacy), is widely used in oncogeriatrics to identify older cancer patients who could benefit from geriatric assessment, and has been validated to predict health outcomes in older cancer patients [247].
The EAU Guidelines Office has endorsed the G8 score as a screening tool for frailty [248-250].
Referral to comprehensive geriatric assessment (CGA), performed by dedicated geriatricians, is advised in patients with a G8 score ≤ 14/17 [247].
The CGA explores several domains: functional capacity, polypharmacy, performance status, cognition, social support, psychological status and nutritional status. The CGA can identify frailty and risk of geriatric syndromes, as well as support clinical decision-making in both localised and metastatic RCC [247,251]. Multidisciplinary management of patients characterised as frail after CGA is essential.
Table 6.2 Frailty and geriatric assessment factors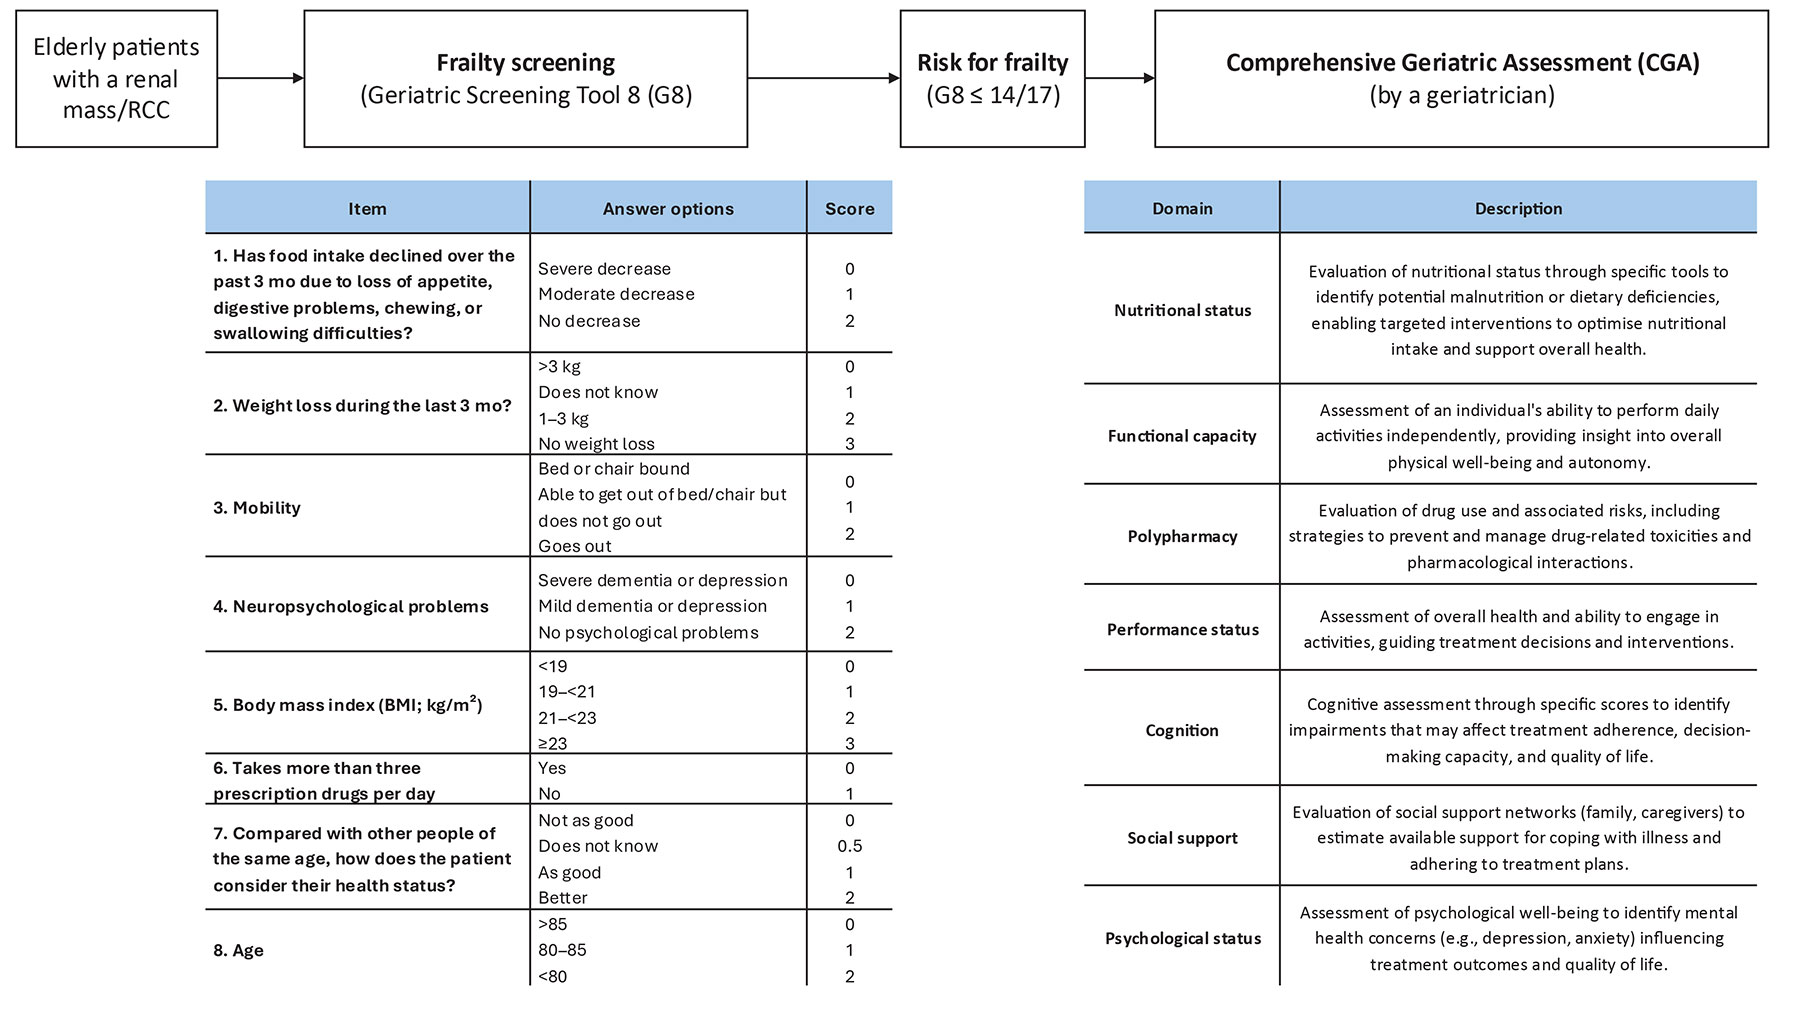
6.4.2. Nephrological assessment
Renal function considerations are key for shared decision-making in patients with localised RCC, considering the bidirectional relationship between RCC and chronic kidney disease (CKD) [252].
Selected patients who are candidate for treatment for RCC may benefit from nephrological consultation, including patients with pre-existing stage 3-5 CKD or proteinuria; patients with a solitary kidney, especially those with borderline/known CKD. Patients with known medical comorbidities that may potentially affect renal function; and patients whose expected new baseline renal function after surgery is below 45ml/min./1.73m2.
To date, while several models have been proposed for predicting postoperative renal function after RCC surgery, most relied on retrospective cohorts, had a high risk of bias and high concern regarding the applicability of the proposed model. As such, most of these models are not ready for routine clinical practice, while a few have been externally validated [253].
In such patients, nephrological consultation before treatment can recommend further diagnostic tests for CKD, optimise CKD risk factors (e.g. hypertension, hyperglycaemia, obesity, etc.), recommend specific lifestyle and/or medical interventions to decrease the risk of acute kidney injury or renal function deterioration after treatment and improve shared decision-making [254].
6.5. Molecular factors
Numerous molecular markers such as carbonic anhydrase IX (CaIX), VEGF, HIF, Ki67 (proliferation), p53, p21 [255], PTEN (phosphatase and tensin homolog) cell cycle [256], E-cadherin, osteopontin [257] CD44 (cell adhesion) [258,259], CXCR4 [260], PD-L1 [261], miRNA, SNPs, gene mutations, and gene methylations have been investigated (LE: 3) [262]. While the majority of these markers are associated with prognosis and many improve the discrimination of current prognostic models, very little emphasis has been placed on external validation studies. Moreover, there is no conclusive evidence on the value of molecular markers for treatment selection in mRCC [229,261,263]. The routine use of molecular markers in clinical practice is therefore not recommended.
Several prognostic and predictive marker signatures have been described for specific systemic treatments in mRCC. In the JAVELIN Renal 101 trial (NCT02684006), a 26-gene immunomodulatory gene signature predicted PFS in those treated with avelumab plus axitinib, while an angiogenesis gene signature was associated with PFS for sunitinib. Mutational profiles and histocompatibility leukocyte antigen types were also associated with PFS, while programmed death-ligand 1 (PD-L1) expression and tumour mutational burden were not [264]. In IMmotion151 (NCT02420821), a T effector/IFN-γ-high or angiogenesis-low gene expression signature predicted improved PFS for atezolizumab plus bevacizumab compared to sunitinib. The angiogenesis-high gene expression signature correlated with longer PFS in patients treated with sunitinib [265]. In CheckMate214 (NCT02231749), a higher angiogenesis gene signature score was associated with better overall response rates and PFS for sunitinib, while a lower angiogenesis score was associated with higher overall relative risk in those treated with nivolumab plus ipilimumab. Progression-free survival > 18 months was more often seen in patients with higher expression of Hallmark inflammatory response and Hallmark epithelial mesenchymal transition gene sets [235].
Urinary and plasma Kidney-Injury Molecule-1 (KIM-1) has been identified as a potential diagnostic and prognostic marker. With KIM-1 concentrations are elevated in RCC patients at least up to five years before diagnosis and were associated with a shorter survival time [266]. Kidney-Injury Molecule-1 is a glycoprotein marker of acute proximal tubular injury and therefore mainly expressed in RCC derived from the proximal tubules such as ccRCC and pRCC [267].
In the CheckMate214 trial comparing ipilimumab plus nivolumab with sunitinib, higher baseline serum KIM-1 levels were associated with shorter OS. A decline in KIM-1 levels correlated with improved PFS and OS in patients treated with ipilimumab and nivolumab [268]. In a post hoc analysis of the IMmotion010 trial in patients with high-risk resected RCC, elevated baseline plasma KIM-1 levels were linked to worse disease-free survival (DFS), but also to improved DFS in those receiving adjuvant atezolizumab versus placebo [269]. These findings suggest that KIM-1 is a promising biomarker and warrants further investigation.
Another promising marker is the urinary glycosaminoglycan score (GAGome) for detecting recurrence after curative surgery for ccRCC. In a prospective study (AURORAX-0087A), the score demonstrated 90% sensitivity and 51% specificity for radiologically confirmed recurrence [270]. A validation study is currently underway.
Several retrospective studies and large molecular screening programmes have identified mutated genes and chromosomal changes in ccRCC with distinct clinical outcomes. The expression of the BAP1 and PBRM1 genes, situated on chromosome 3p in a region that is deleted in more than 90% of ccRCCs, have shown to be independent prognostic factors for tumour recurrence [271-274]. These published reports suggest that patients with BAP1 mutant tumours have worse outcomes compared with patients with PBRM1 mutant tumours [272]. Loss of chromosome 9p and 14q have been consistently shown to be associated with poorer survival [275-277]. The TRACERx renal consortium has proposed a genetic classification based on RCC evolution (punctuated vs. branched vs. linear), which correlates with tumour aggressiveness and survival [276]. Additionally, a 16-gene signature was shown to predict DFS in patients with non-metastatic RCC [278]. However, these signatures have not been validated by independent researchers yet.
6.6. Prognostic models
Prognostic models combining independent prognostic factors have been developed and externally validated [279-286]. These models are more accurate than TNM stage or grade alone for predicting clinically relevant oncological outcomes [287] (LE: 3). Before being adopted, new prognostic models should be evaluated and compared to current prognostic models with regards to discrimination, calibration and net benefit. Pathological prognostic factors are used in the Leibovich 2003 score/groups for ccRCC [282]. Prognostic models for non-ccRCC are available, such as the VENUSS score for pRCC [288]. Although both were validated in several studies and showed superior discrimination to other prognostic models, molecular markers are needed [289-292]. In metastatic disease, risk groups assigned by the Memorial Sloan Kettering Cancer Centre (MSKCC) (primarily created in the pre-targeted therapy era and validated in patients receiving targeted therapy) and the IMDC (initially created in the targeted therapy era) differ in 23% of cases [293]. The IMDC model has been used in most of the recent RCTs, including those with immune checkpoint inhibitors (ICIs), and may therefore be the preferred model for clinical practice. The IMDC model has been shown to be of continued use for risk stratifying patients with mRCC treated with contemporary first-line IO combination therapies [294].
The discrimination of the IMDC models improves by additional variables, such as presence of brain metastasis, bone metastasis, liver metastasis, NLR and platelet count [295-298]. Tables 6.3 and 6.4 summarise the current, most-relevant prognostic models.
6.7. Summary of evidence and recommendations for prognostic factors
| Summary of evidence | LE |
| In RCC patients, TNM stage, tumour size, grade and RCC subtype provide important prognostic information. | 2a |
| The 2003 Leibovich score is a validated prognostic model to predict the short- and long-term risk of metastasis in individual patients with sporadic, unilateral pT1-4 N0/+ M0 ccRCC. | 2b |
| The VENUSS score is a validated prognostic model to predict the short- and long-term risk of disease recurrence in individual patients with sporadic, unilateral pT1-4 N0/+ M0 pRCC. | 2b |
| Frailty is associated with adverse clinical outcomes in patients undergoing treatment for non-metastatic RCC. | 3 |
| There is a bidirectional relationship between RCC and CKD. | 3 |
| Recommendations | Strength rating |
| Use the current Tumour, Node, Metastasis classification system. | Strong |
| Use the WHO/ISUP grading system and classify RCC type. | Strong |
| Use prognostic models in localised and metastatic disease. | Strong |
| Use the 2003 Leibovich scoring model for risk stratification of localised and locally advanced clear cell RCC. | Weak |
| Use the VENUSS scoring model for risk stratification of localised and locally advanced papillary RCC. | Weak |
| Do not routinely use molecular markers to assess prognosis. | Strong |
| Screen elderly patients with a renal mass/RCC with a validated geriatric frailty score to identify patients at risk for frailty. | Weak |
| Offer comprehensive geriatric assessment in elderly patients whose screening revealed a risk for frailty. | Weak |
| Offer pre-treatment nephrological consultation in selected patients with or at risk for impaired renal function (e.g. pre-existing chronic kidney disease or proteinuria; solitary kidney, known medical comorbidities affecting renal function; new baseline eGFR below 45ml/min./1.73m2) | Weak |
eGFR = estimated glomerular filtration rate; ISUP = International Society of Urological Pathology; WHO = World health organisation; VENUSS = venous involvement, necrosis, size, stage and sarcomatoid differentiation.
Table 6.3: Prognostic models for localised RCC
| Prognostic model | Subtype* | Risk factors/prognostic factors |
| UISS** [299] | All |
T1N0M0G1-2, ECOG PS 0: low-risk disease |
| Leibovich score/model 2003 [282] | CC |
0-2 points: low-risk disease |
| Leibovich score/model 2018 [300] | CC, P, CH | ccRCC
pRCC
chRCC
|
| VENUSS score/model*** [288,289] | P |
0-2 points: low-risk disease |
| GRANT score/model**** [301] | All |
0-1 factors: favourable-risk disease |
* ccRCC = clear-cell RCC; ECOG = Eastern Cooperative Oncology Group; pRCC = papillary RCC; chRCC = chromophobe RCC; PS = performance status.
** University of California Integrated Staging system. Available at https://www.mdcalc.com/ucla-integratedstaging-system-uiss-renal-cell-carcinoma-rcc.
*** Venous extension, Nuclear grade, Size, Stage. Available at https://www.evidencio.com/models/show/2369.
**** Grade, Age, Nodes and Tumour.
Table 6.4: Prognostic models for metastatic RCC
| Prognostic model | Subtype | Risk factors/prognostic factors |
| MSKCC [302]** | All |
0 factors: favourable-risk disease |
| IMDC [304]*** | All |
0 factors: favourable-risk disease |
IMDC = International Metastatic Renal Cancer Database Consortium; LDH = lactate dehydrogenase; MSKCC = Memorial Sloan Kettering Cancer Center; PS = performance status.
* Karnofsky performance status calculator: https://www.thecalculator.co/health/Karnofsky-Score-for-Performance-Status-Calculator-961.html.
** MSKCC: https://www.mdcalc.com/memorial-sloan-kettering-cancer-center-mskcc-motzer-coreetastaticrenal-cell-carcinoma-rcc.
*** IMDC: https://www.mdcalc.com/imdc-international-metastatic-rcc-database-consortium-risk-score-rcc.